
Overview
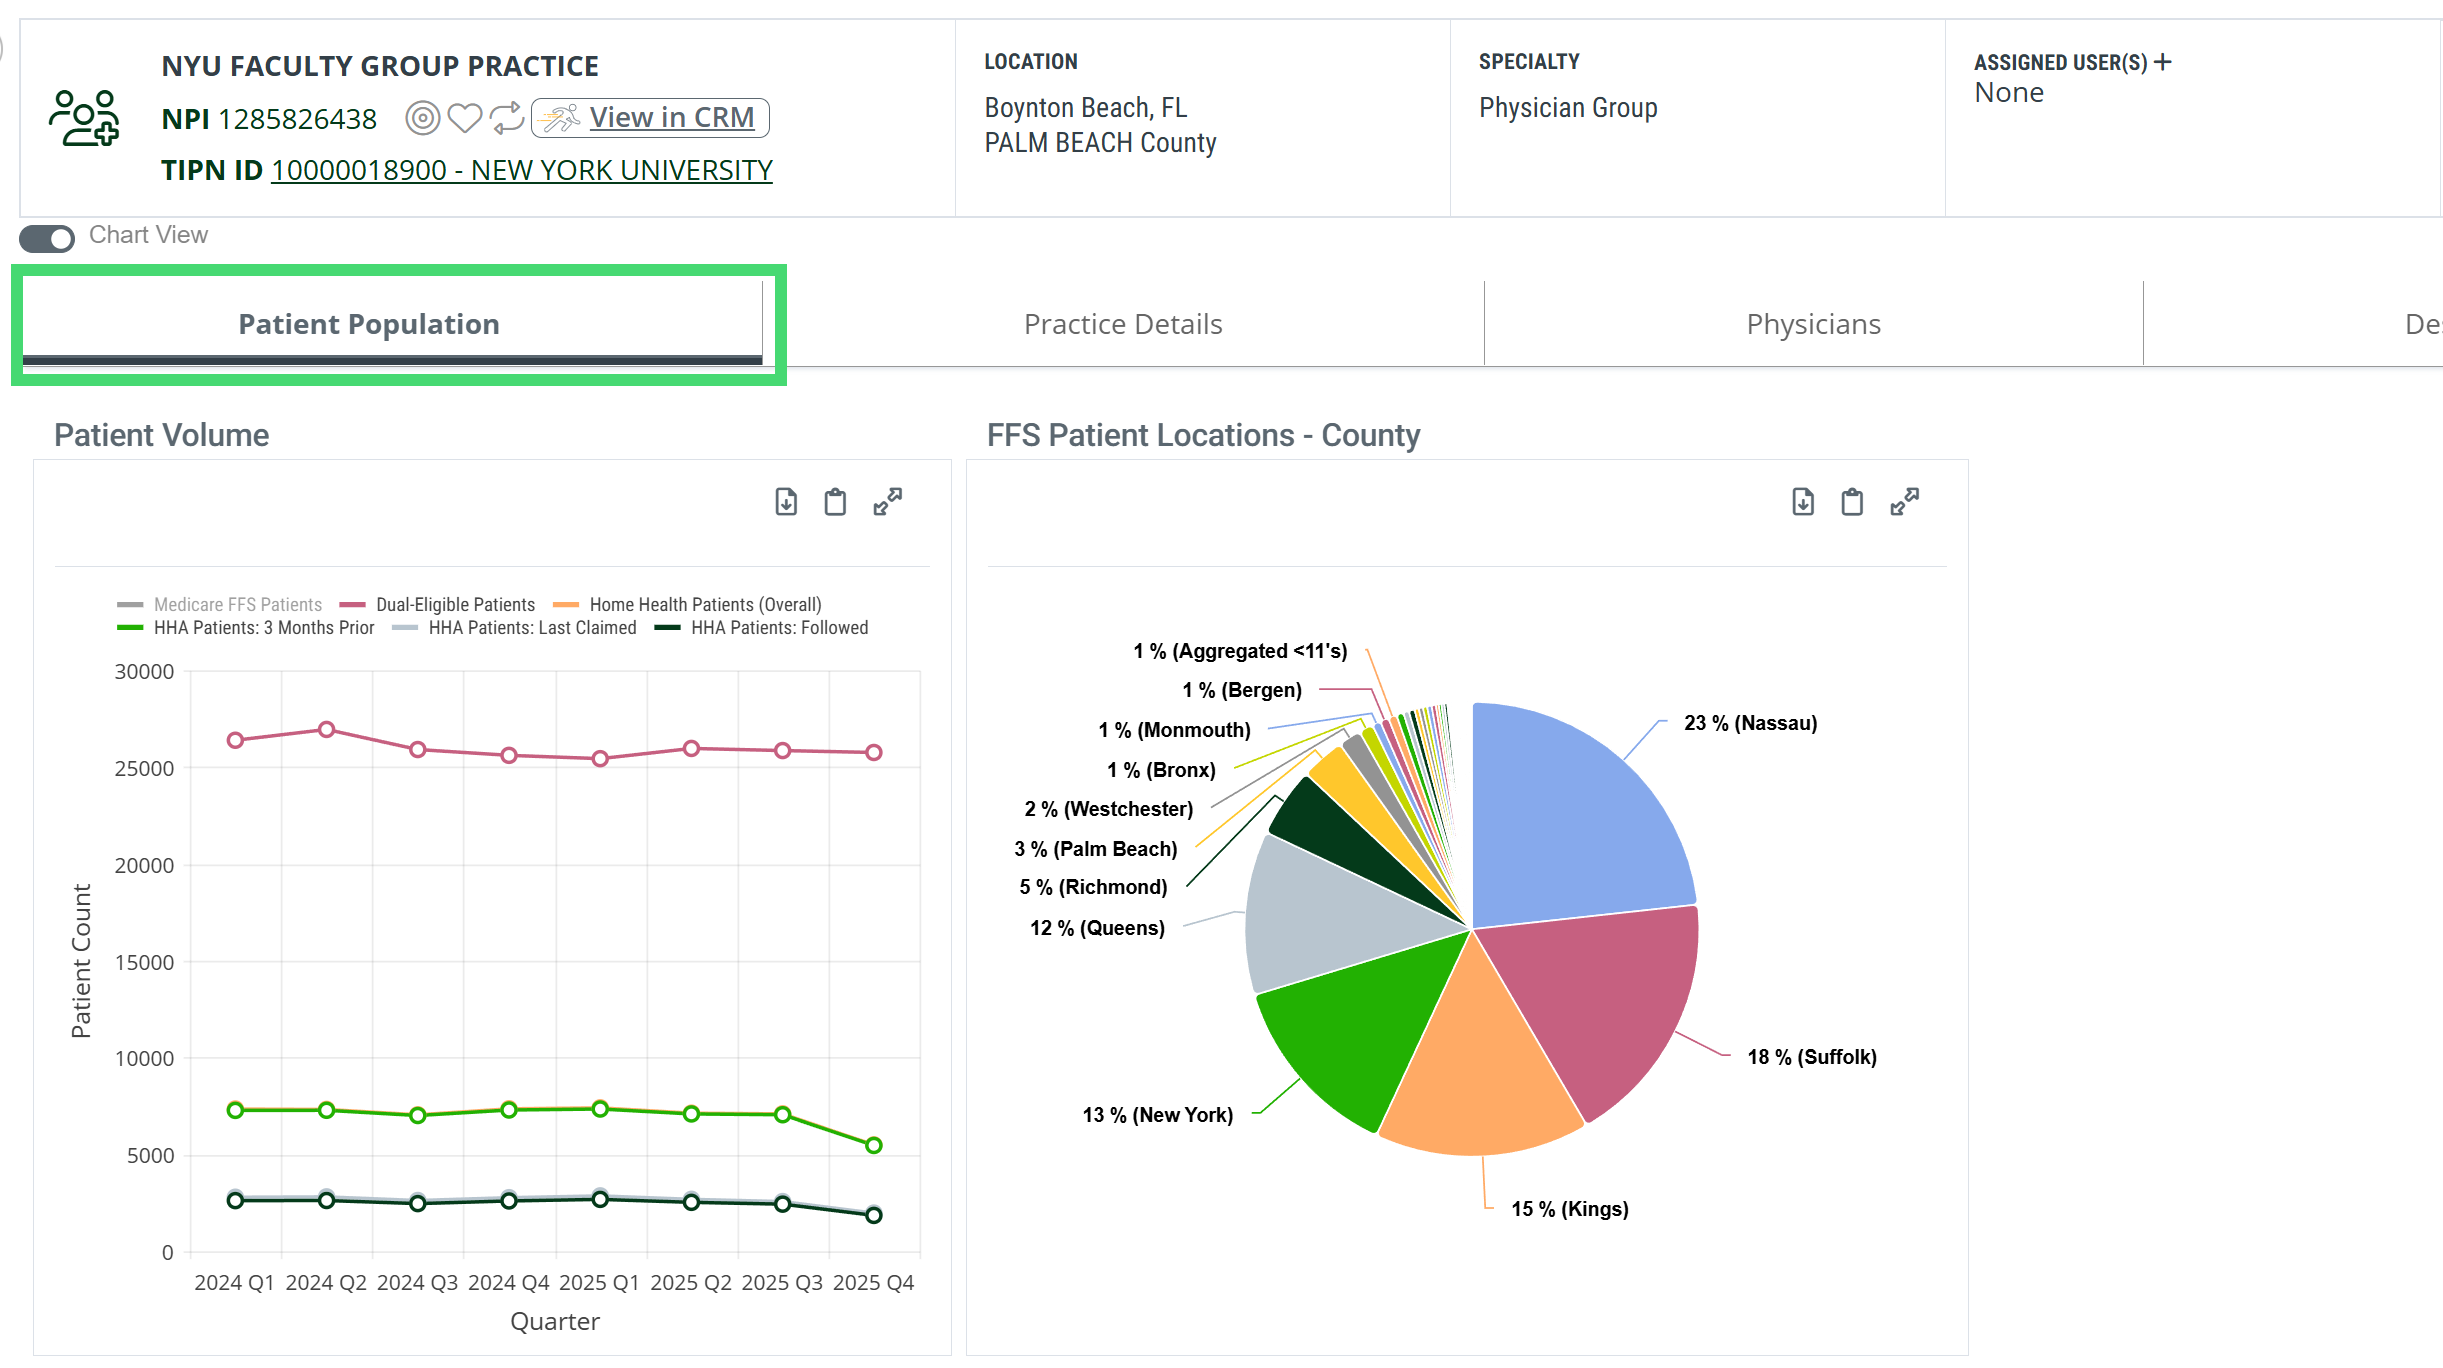
The Patient Population tab on the Physician Group Analyze page shows patient volume history and geographic distribution for the selected physician group. The tab has two tables — Patient Volume and FFS Patient Locations - County.
 Let's get Oriented
This tab tells the volume and location story for the selected group — how many Medicare FFS patients it's associated with, how many of those flow into home health, how that pattern has shifted over the last eight rolling quarters, and where those patients live. To get here: open the Physician Groups Explore page, click a group's name to open its Analyze page, then click the Patient Population tab.
In this article
 Scroll through the article to learn about the tables on this tab, or use the links below to navigate directly.
Chart View
At the top left of the page you will find a toggle that allows you to turn chart view on and off. With chart view on, some content will be shown as a chart; with chart view off, most content on the page will be shown in tables.
 Not all tables have a chart view, and some charts don't have a table view.
Chart View On |
Chart View Off |
 |
 |
|
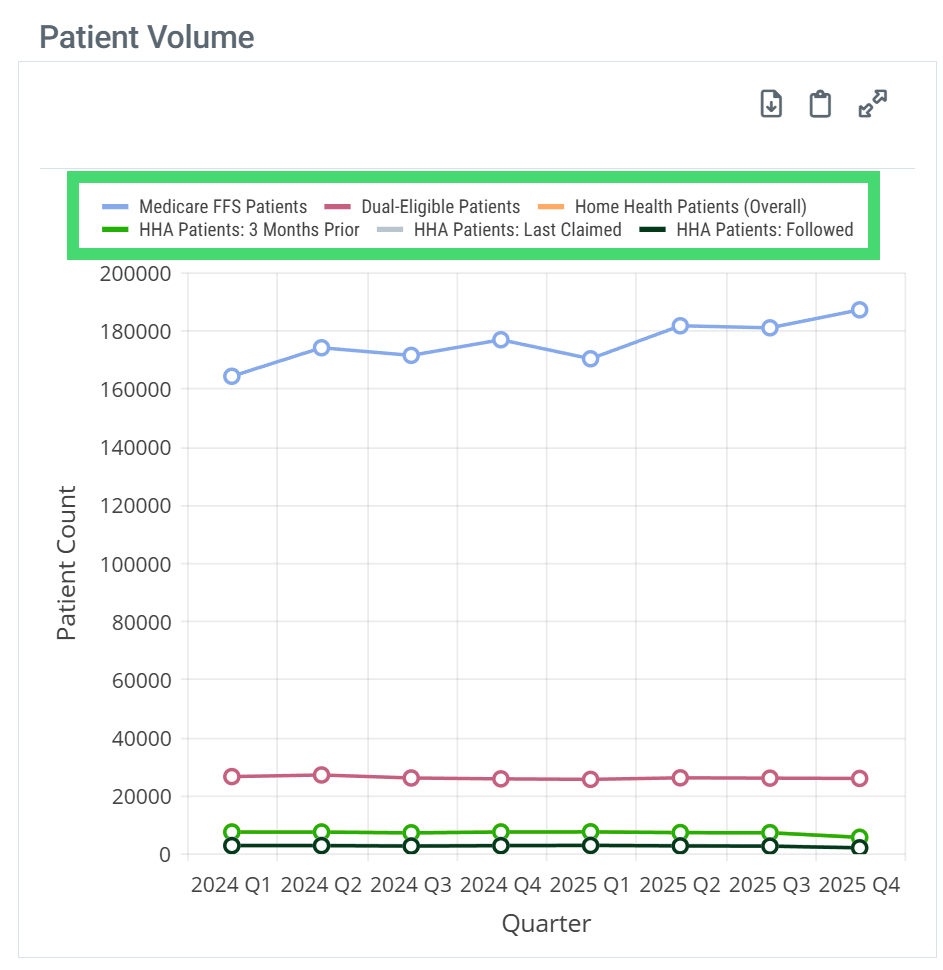
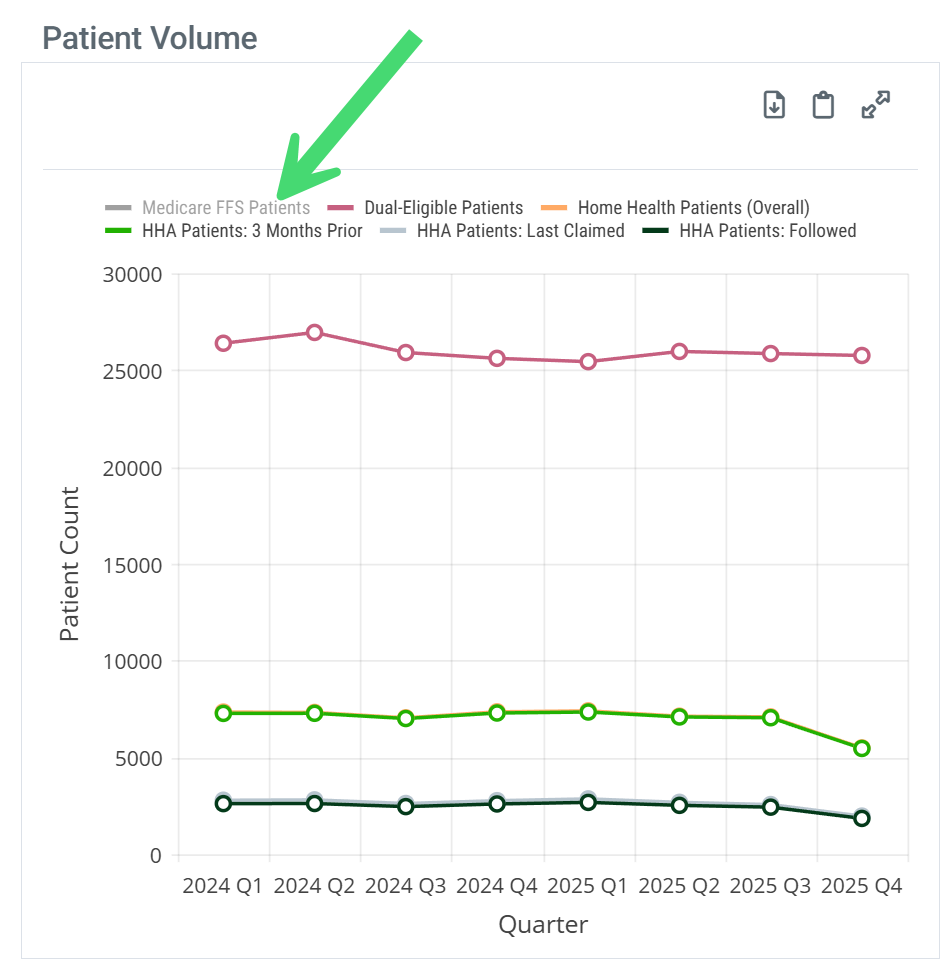
Legend — Some charts have a legend that identifies the elements in the chart. Each identifier in the legend can be toggled on and off to display or hide the matching elements in the chart. Hovering over an identifier highlights the related elements in the chart.
| |
 |
 |
 |
Patient Volume
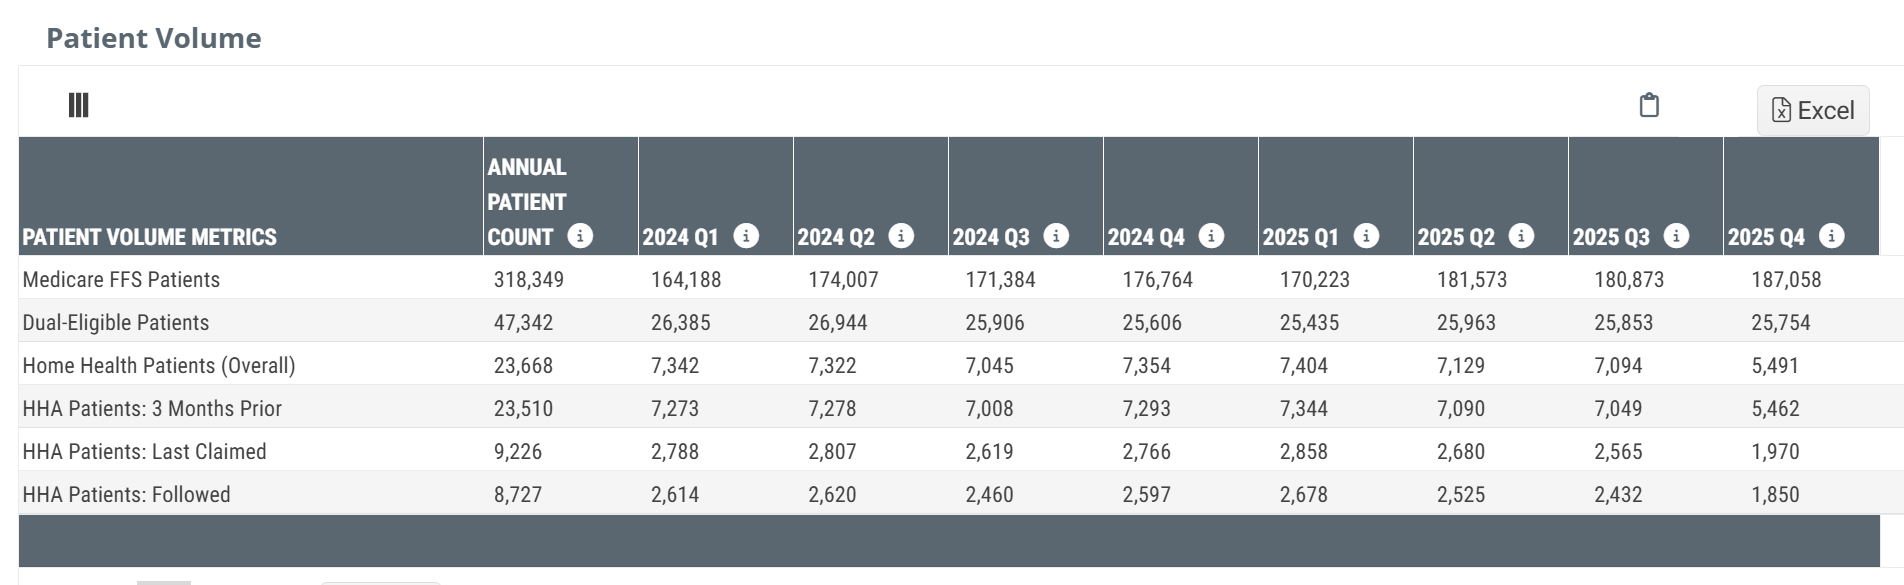
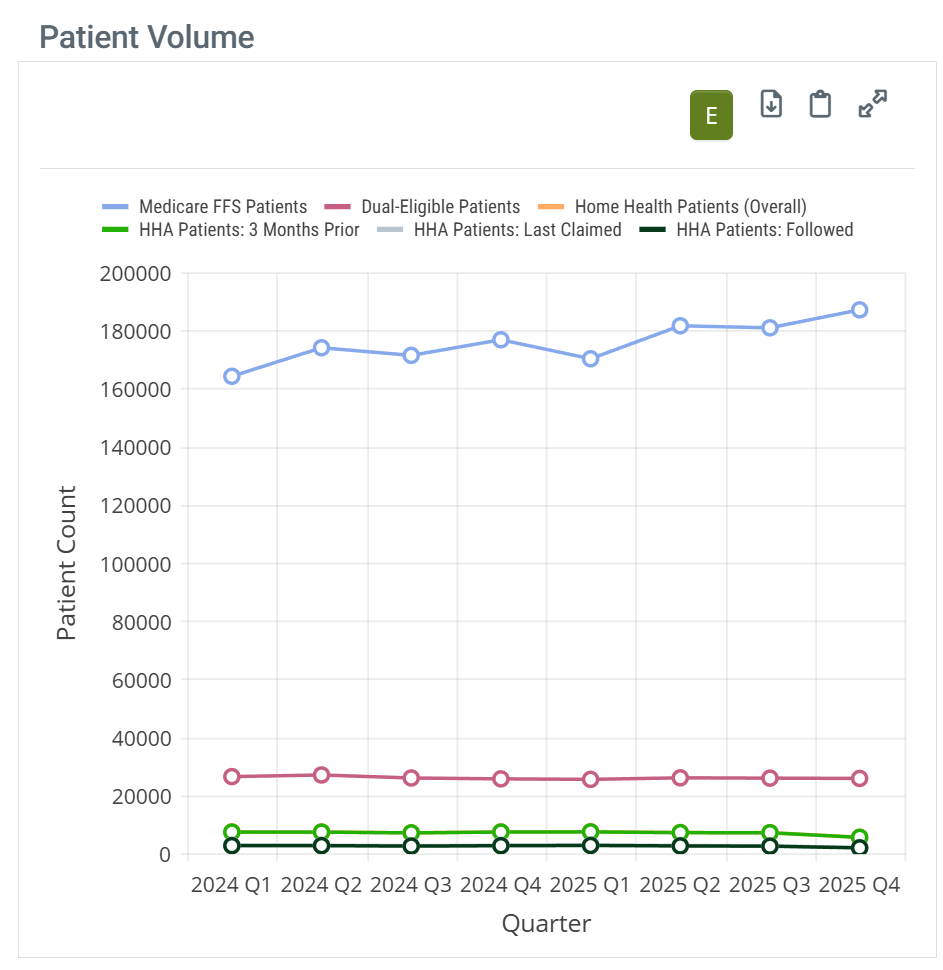
The Patient Volume table displays the selected physician group's patient counts annually and by quarter — Medicare FFS patients broadly, dual-eligible patients, and home health patients by claim relationship type, trended across eight rolling quarters.
Chart View and Table View
|
Off
|
 |
|
On
|
 |
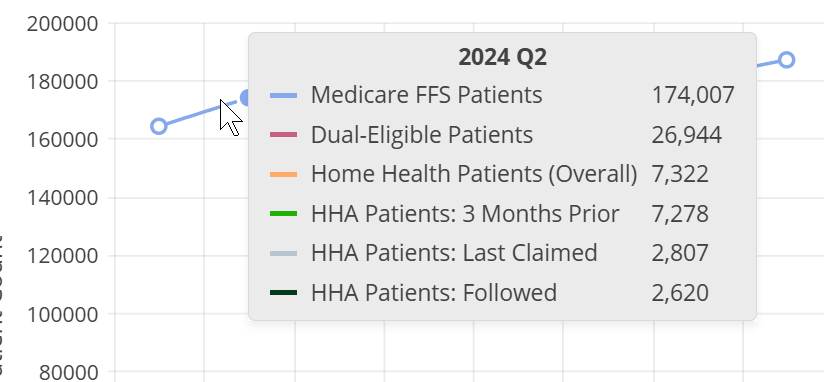
| When you hover over a line in the Patient Volume chart, the counts for each metric at that point in time are displayed. |
 |
|
With chart view on, the Patient Volume chart has a legend that identifies each metric series. Each identifier in the legend can be toggled on and off to display or hide the matching trend line. Hovering over an identifier highlights the related line.
| |
| Chart Legend | Legend Customize |
|
|
|
Understanding the Metrics
| Patient Volume Metric | Description |
| Medicare FFS Patients | The count of distinct Medicare FFS patients who received care from clinicians in the listed physician group during the specified time period, identified either through claims billed under the group’s NPI or through attribution linking the treating physician to the physician group. Quarterly patient counts do not sum to the annual patient count — the annual figure uses a distinct one-year calculation window. |
| Dual-Eligible Patients | The count of distinct Medicare FFS patients who were eligible for Medicaid coverage and who received care from clinicians in the listed physician group during the specified time period, identified either through claims billed under the group’s NPI or through attribution linking the treating physician to the physician group. |
| Home Health Patients (Overall) | The count of distinct Medicare FFS patients treated by the physician group who received home health services and qualified under Followed, 3 Months Prior, or Last Claimed pathways during the specified time period. |
| HHA Patients: 3 Months Prior | The count of distinct Medicare FFS patients who received home health services for whom the physician group appeared on a professional Part B claim within 3 months prior to the patient’s home health admission during the specified time period. |
| HHA Patients: Last Claimed | The count of distinct Medicare FFS patients who received home health services for whom the physician group appeared on the last professional Part B claim prior to the patient’s home health admission during the specified time period. |
| HHA Patients: Followed | The count of distinct Medicare FFS patients who received home health services for whom a physician in the physician group was listed as the certifying physician on the home health claim during the specified time period. |
|
FFS Patient Locations - County
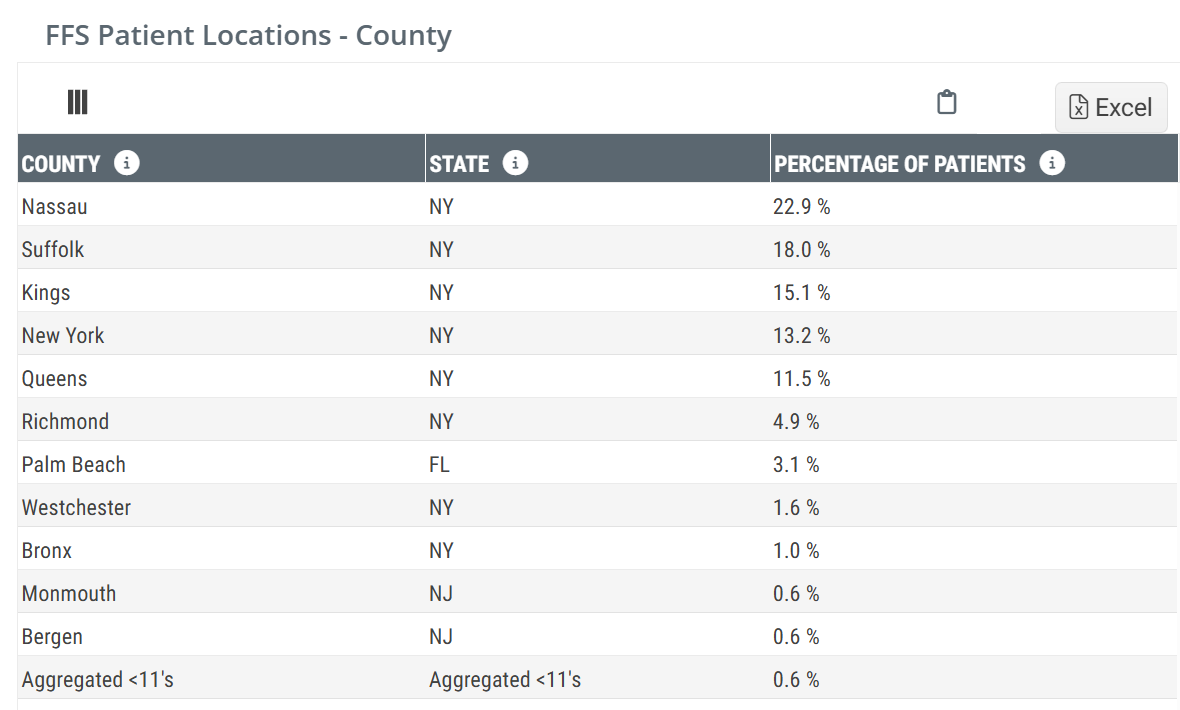
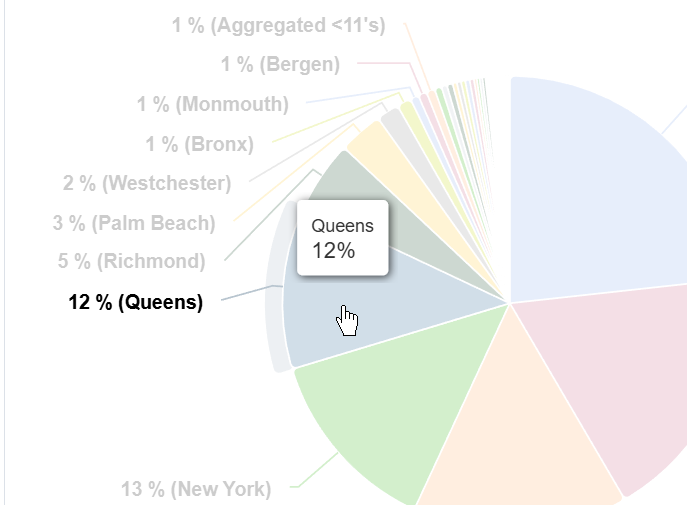
The FFS Patient Locations - County table shows the geographic distribution of the selected physician group's Medicare FFS patients by county of residence. Each row represents one county, with the percentage of the group's FFS patients who reside in that county.
Chart View and Table View
|
Off
|
 |
|
On
|
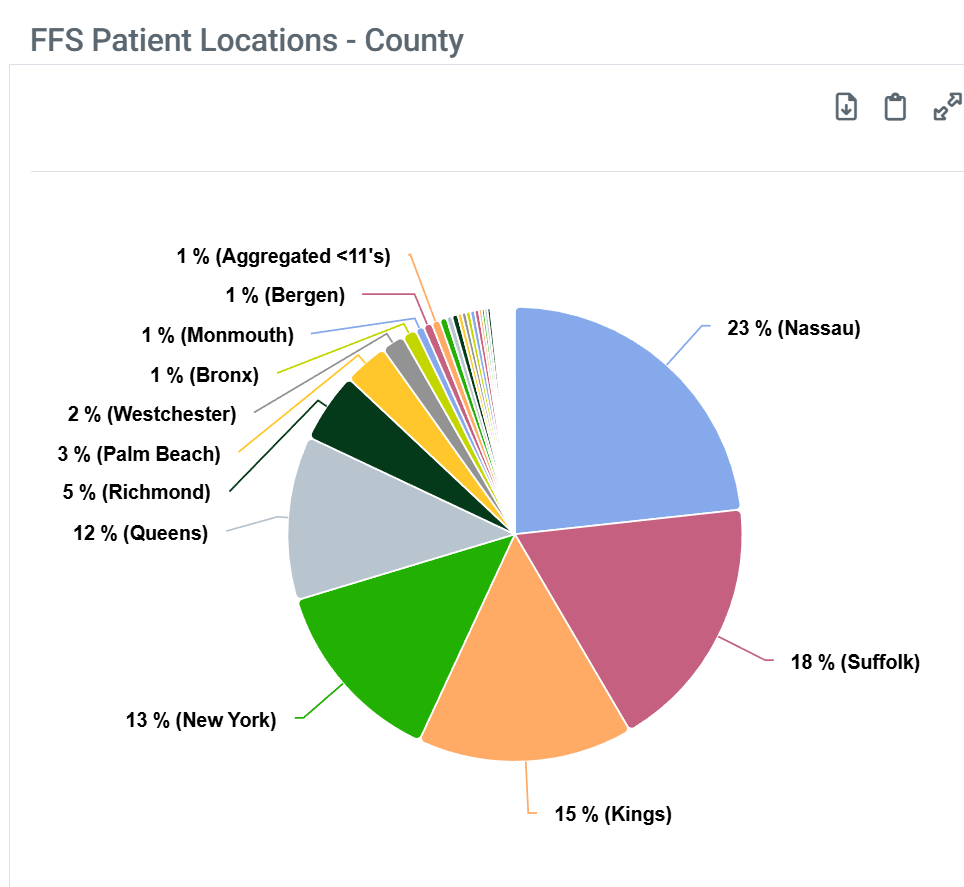 |
| When you hover over a sector in the FFS Patient Locations - County chart, the metrics for that county are displayed. |
 |
| The FFS Patient Locations - County chart does not have a legend. |
Understanding the Metrics
| FFS Patient Locations Metric | Description |
| County | The name of the county of residence. |
| State | The state in which the county is located. Included to distinguish counties with the same name in different states, which may occur when a physician group's patients span state lines. |
| Percentage of Patients | The percentage of the selected physician group's Medicare FFS patients who reside in the listed county. |
Counties where the percentage is calculated from fewer than 11 patients are not identified individually. They are combined and displayed in a row titled Aggregated INS Counties.
Because patient location is based on the patient's county of residence — not the physician group's practice location — the table may include counties in states other than where the group is located. This is especially common for groups near state lines.
|
 Putting the Data to Work
Understand the group's full practice size vs. its home health volume. Compare Medicare FFS Patients to Home Health Patients (Overall). A group with a large FFS count but a small home health count is a high-potential target — the patients are there, but they're not going to home health at the rate you'd expect. That gap is the conversation.
Use the relationship types to understand how you can reach the group. The 3 Months Prior count tells you how many patients this group was recently treating before their home health admission — physicians with a high 3 Months Prior count are active in the period when home health referral decisions are made. The Followed count tells you how many physicians in this group stay engaged with patients during their home health episode — a strong indicator of an active clinical relationship worth cultivating.
Look for volume trends before you reach out. Use the quarterly data to see whether the group's home health patient volume is growing, stable, or declining. A group with a rising trend is an expanding referral opportunity. A declining trend may reflect a shift in practice patterns worth understanding before investing heavily in outreach.
Use patient location data to target your outreach geographically. The FFS Patient Locations - County breakdown shows where the group's Medicare FFS patients live. If a significant percentage of patients are concentrated in one or two counties, that signals where the group has clinical reach — and where an HHA with a strong local presence has the most to offer in the conversation.
|