Park
Overview
The Medicare Advantage Contracts report provides detailed information for specific Medicare Advantage contracts identified by contract code and broken out by your selected region. The report can be found on the Reports page for Marketscape Insights for Home Health and Marketscape Insights for Skilled Nursing.
 Usage
Usage
- After setting a territory using the Patient Location filter, every MA plan in the selected territory is displayed and can be searched, browsed, and sorted.
- It is easy to evaluate historical acute and post-acute utilization metrics to identify trends and patient volumes for specific MA plans in a selected territory.
- Access to long term trends and the latest patient volume metrics expedites evaluation of specific MA plans
- Knowing the details of MA plans for specific territories helps you to make more informed contracting decisions.
- After searching on the Medicare Advantage Contracts Report page and finding a MA contract of interest, you can drill down into the metrics for a specific MA contract.
- 10-year enrollment trends for any territory (state or county, or states and counties)
- 5-year hospital, home health and skilled nursing utilization trends for any territory
 In this article
Page Overview
Use the following image to familiarize yourself with the Medicare Advantage Contracts Report page.
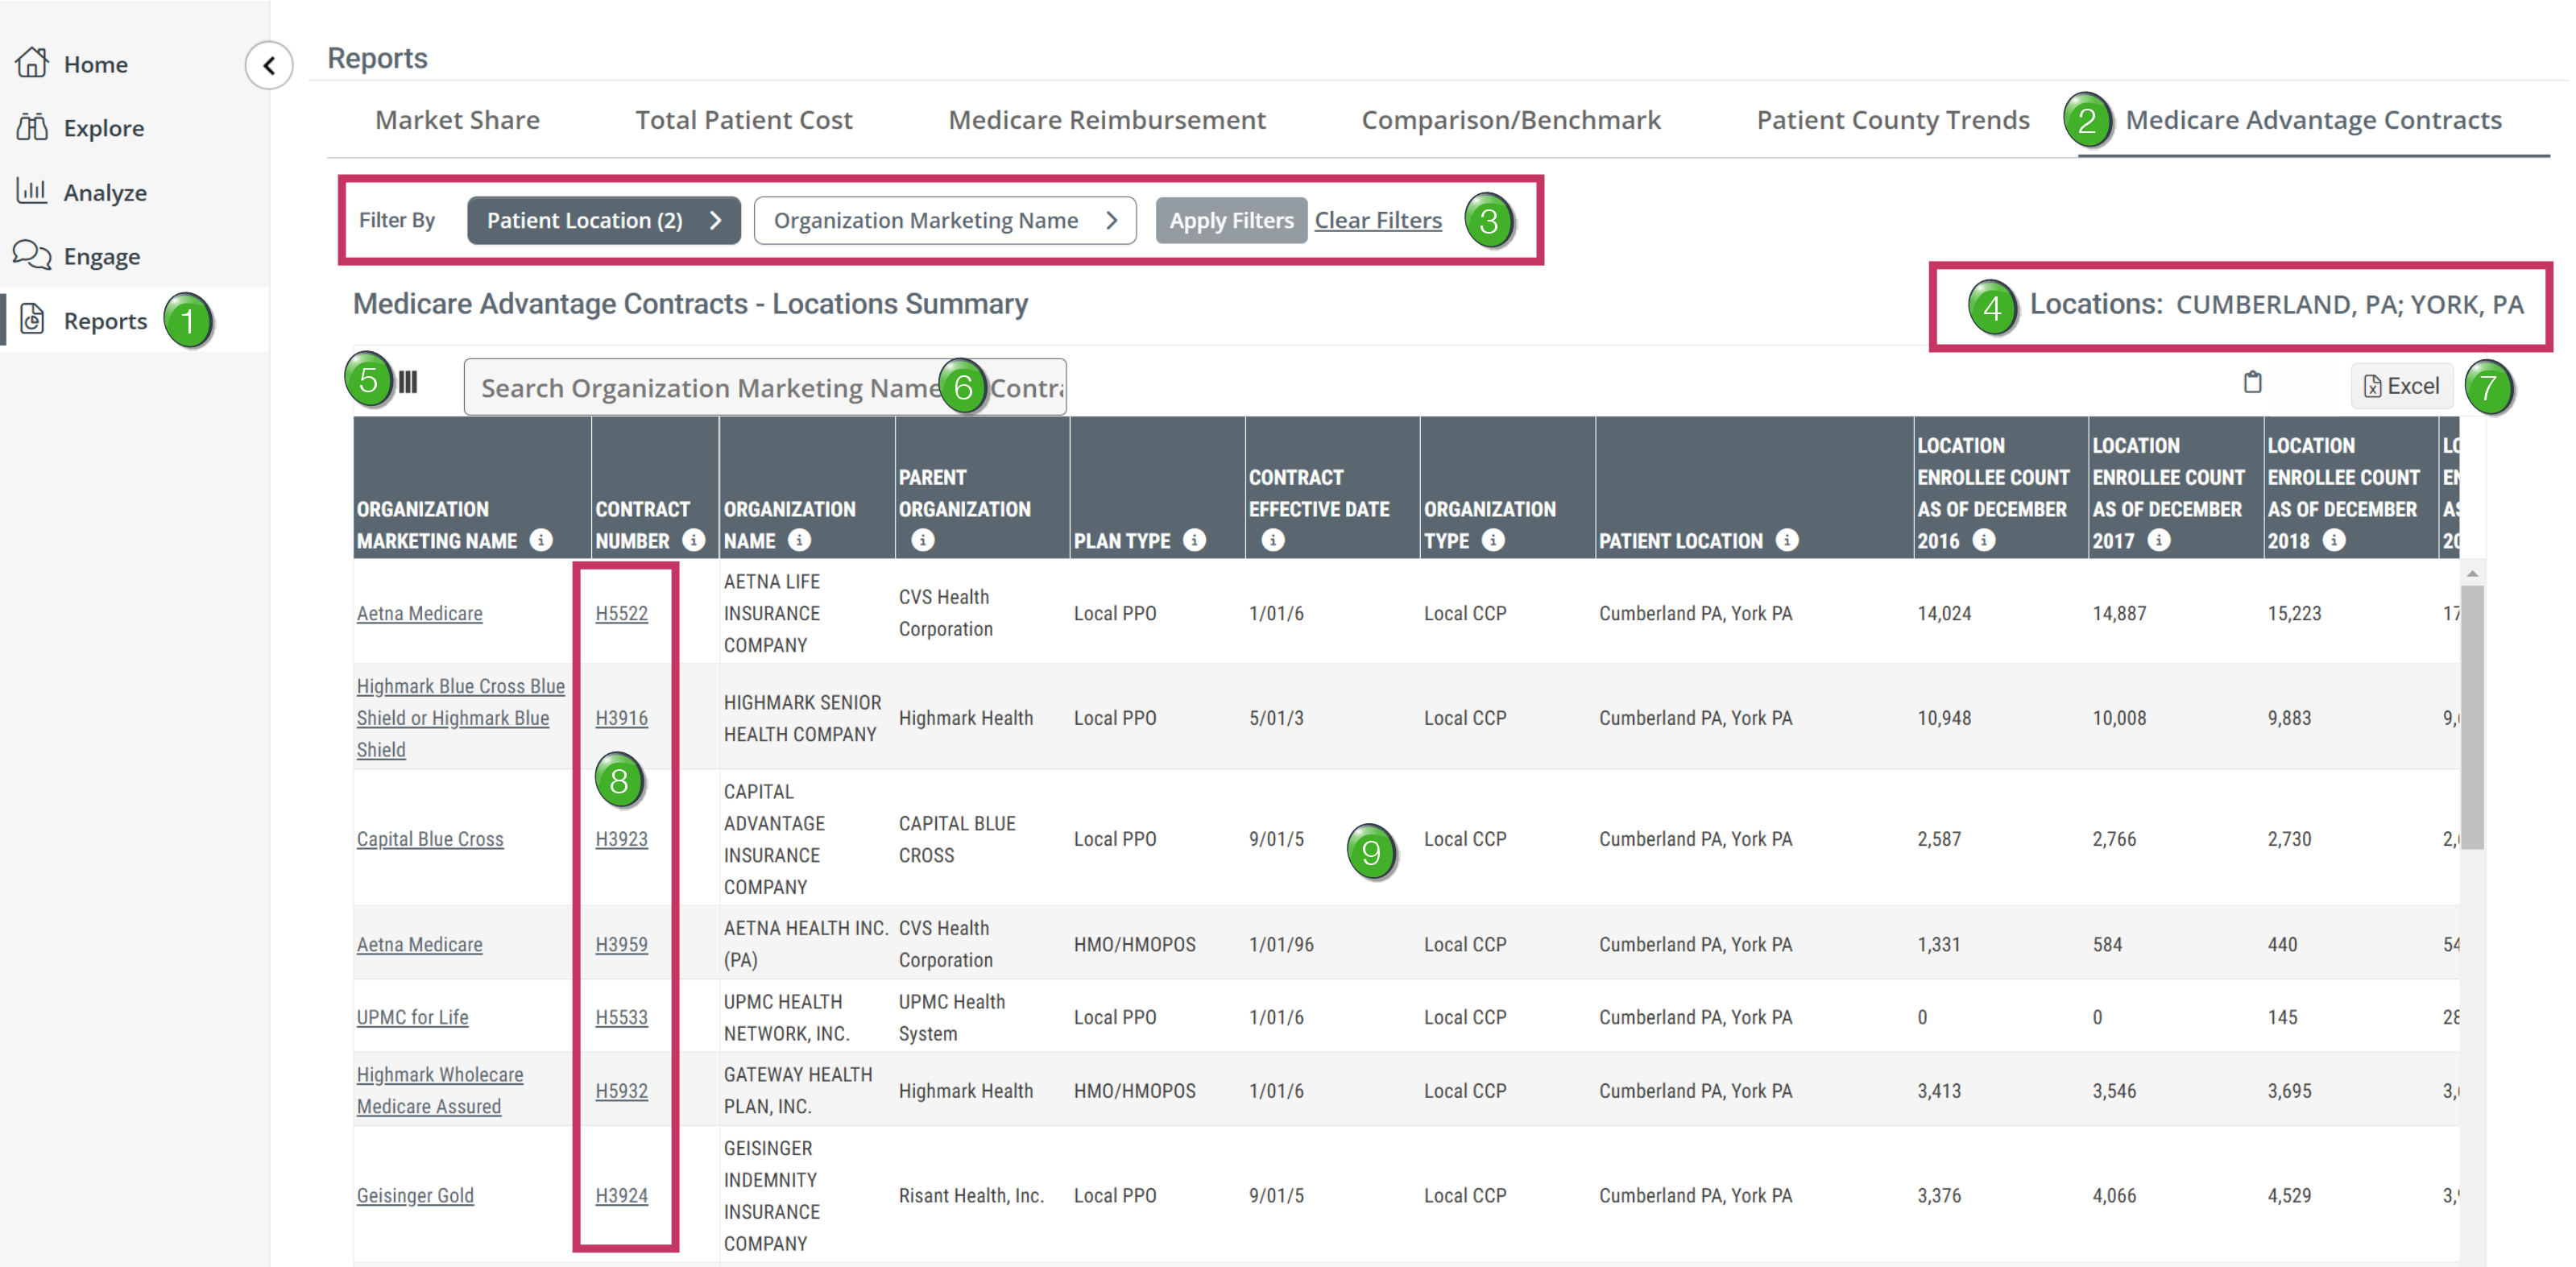
Click on a number to jump directly to that content.
|
|
 |
![]() Click on the "Medicare Advantage Contracts" tab at the top of the page to open the Medicare Advantage Contracts report.
Click on the "Medicare Advantage Contracts" tab at the top of the page to open the Medicare Advantage Contracts report.
![]() Each tab contains a different report.
Each tab contains a different report.
![]() Filters - The filters allow you to limit the metrics shown in the table to regions of your choice or to specific organizations by name. Regions can be a state, or states, or a county, or multiple counties.
Filters - The filters allow you to limit the metrics shown in the table to regions of your choice or to specific organizations by name. Regions can be a state, or states, or a county, or multiple counties.
![]() Filters must be set for each table individually.
Filters must be set for each table individually.
![]() For details, see Setting the Filters, below.
For details, see Setting the Filters, below.
![]() Filter Identification - The current filter settings are displayed above the table.
Filter Identification - The current filter settings are displayed above the table.
![]() There is a column in the table called "Patient Location" that shows the filter details. This column is turned off by default. See
There is a column in the table called "Patient Location" that shows the filter details. This column is turned off by default. See ![]() , next.
, next.
|
|
 |
![]() Table Search - Type in an organization name, or a contract code. The table will show all entries that match your search words.
Table Search - Type in an organization name, or a contract code. The table will show all entries that match your search words.
![]() Excel Export - If you want to export the metrics in the table so you can examine the metrics using the spreadsheet tools in Excel, click the "Excel" button
Excel Export - If you want to export the metrics in the table so you can examine the metrics using the spreadsheet tools in Excel, click the "Excel" button ![]() . The contents of the table will be downloaded and will be available in your download folder.
. The contents of the table will be downloaded and will be available in your download folder.
|
|
 |
![]() For the details about the Contract Number Details page, see Contract Details.
For the details about the Contract Number Details page, see Contract Details.
![]() The table will show you all entries that match the filters and search parameters you set.
The table will show you all entries that match the filters and search parameters you set.
![]() The Medicare Advantage Contracts page contains 6 different tables. Each table will contain different columns of metrics, but the basic tools shown above will work the same in all tables.
The Medicare Advantage Contracts page contains 6 different tables. Each table will contain different columns of metrics, but the basic tools shown above will work the same in all tables.
Setting the Filters
Each table has its own filter and must be set independently of other tables on the same page. However, there are only two filters available for all six tables on the page; "Patient Location" and "Organization Marketing Name." The tables on the Contract Details page only use the "Patient Location" filters.
Follow the steps below to set the filters.
|
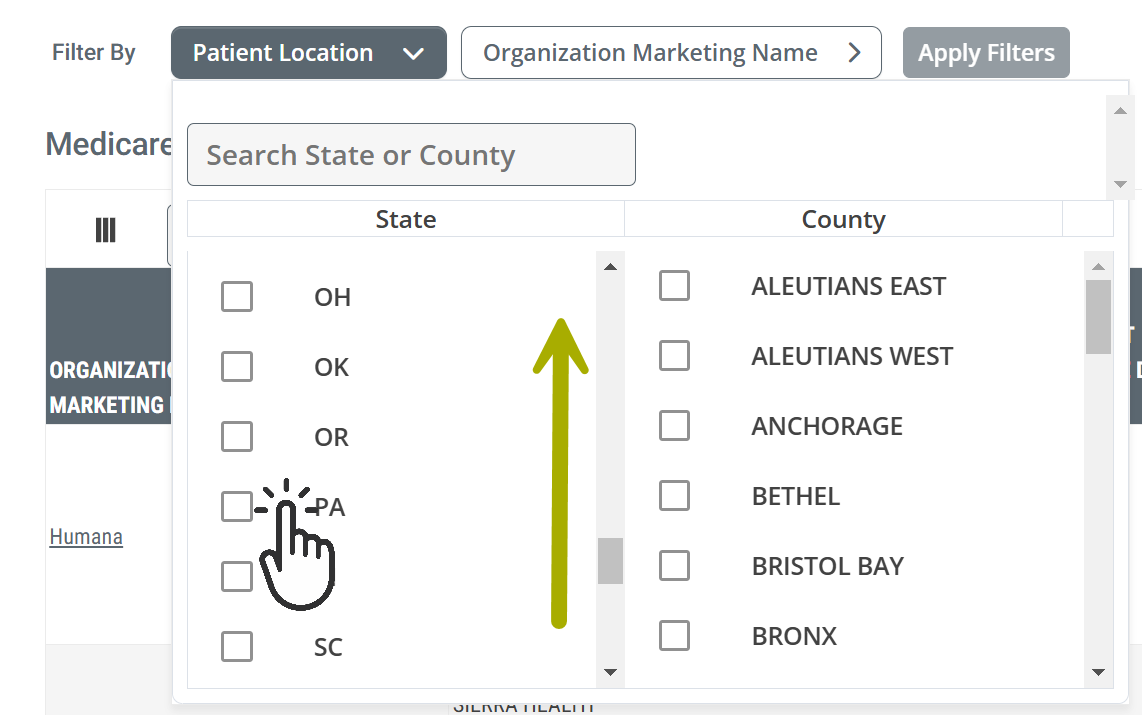
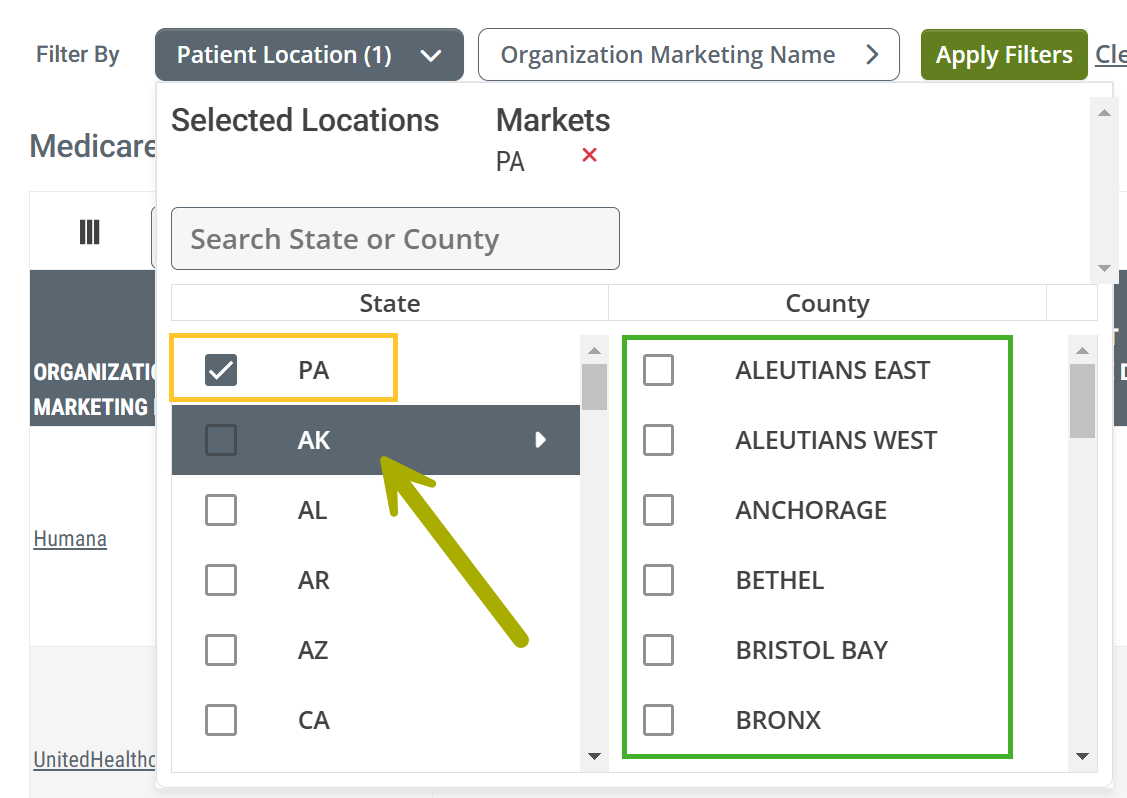
Patient Location
You can choose multiple states. |
 |
|
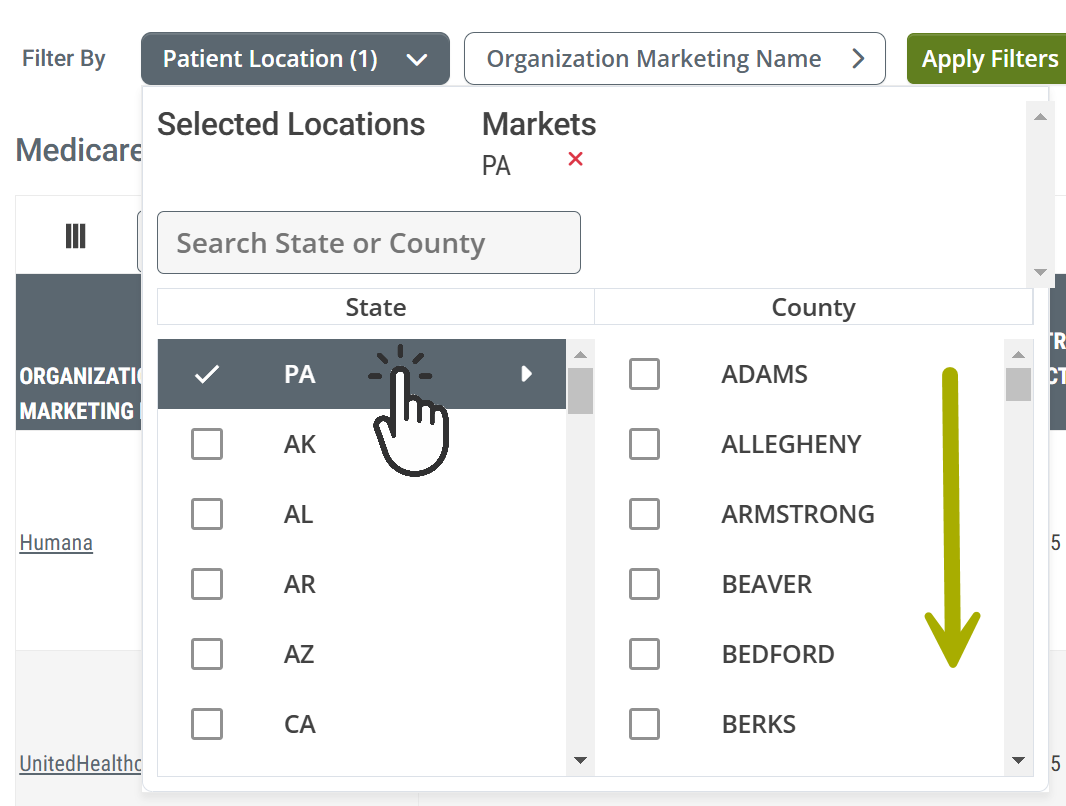
Focus
This is because "AK" has focus - the "AK" row is highlighted. The highlighted row determines which counties are shown in the "County" column.
|
 |
|
If you don't want to limit the metrics in the table at the county level, click the "Apply Filters" button when you have chosen a state or states. |
|
|
Choose Counties
|
 |
|
Apply Filters
|
 |
|
|
|
|
It is not necessary to set the "Organization Marketing Name" filter. If you only select a location filter, the table will show all MA Contracts active in the selected region.
|
|
|
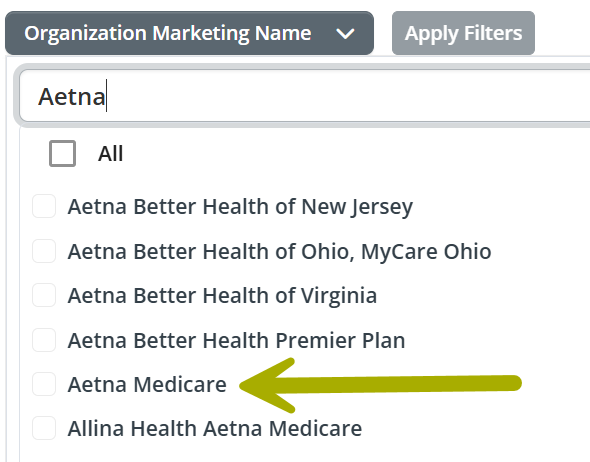
Organization Marketing Name The easiest way to set the "Organization Marketing Name" filter is to know what you are looking for in advance
|
 |
|
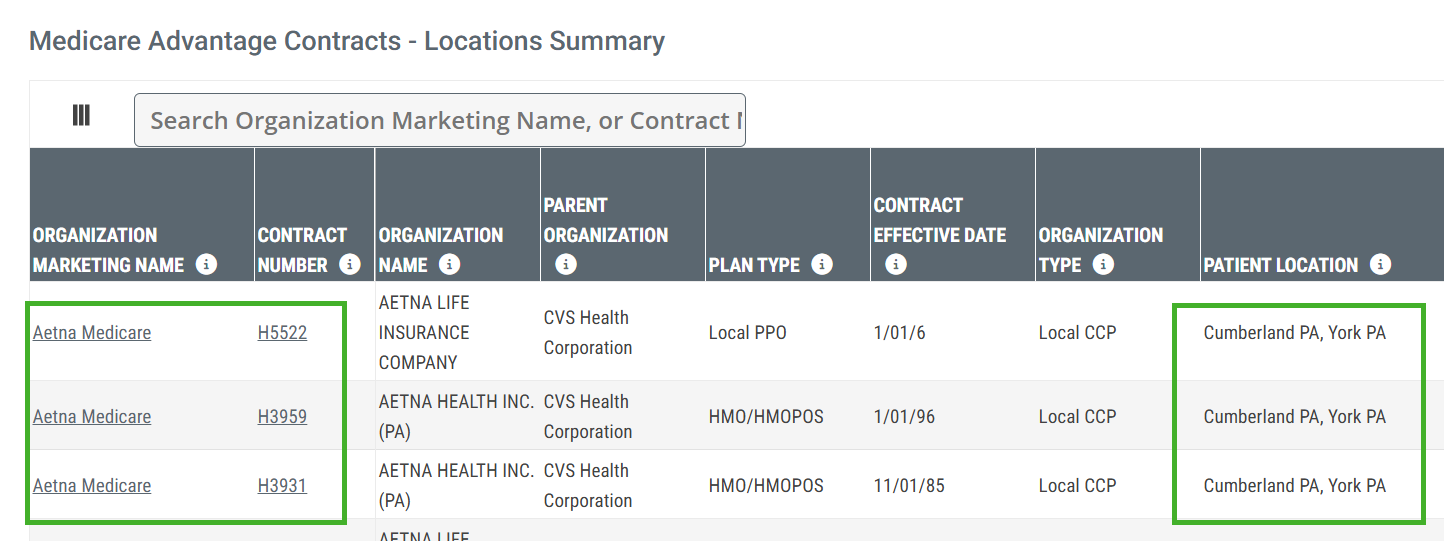
Results With the filters applied, the table shows Contracts for Aetna Medicare (left box) in the specified counties (right box) |
 |
Search Tables
Locations Summary vs Locations Breakdown
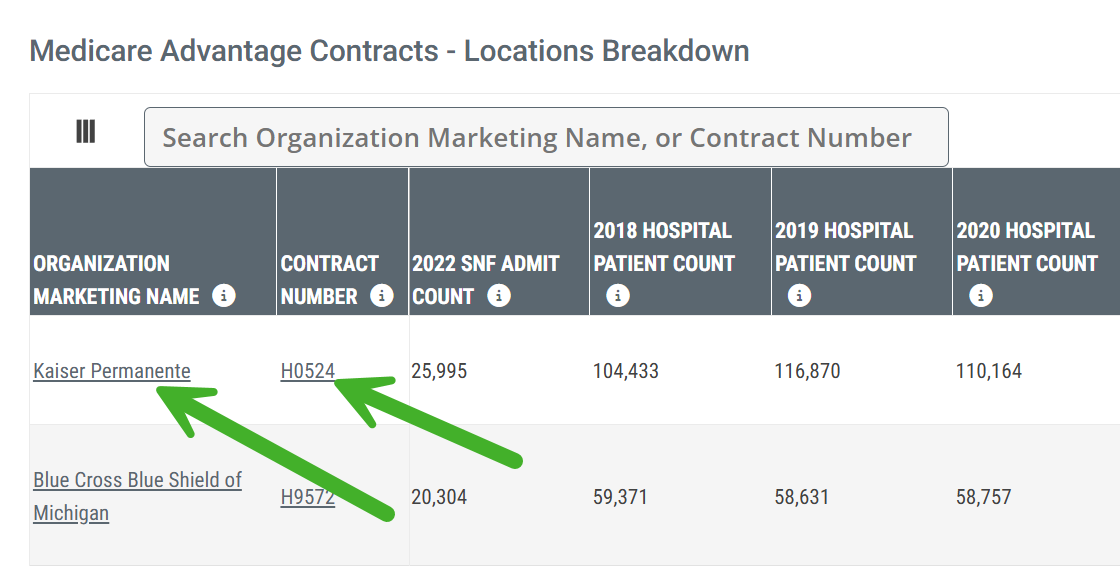
There are two tables on the Medicare Advantage Contracts Report page. There are similarities and differences between the tables which will impact what you see in each.
Use the following image as a guide to understanding the differences between the two tables.
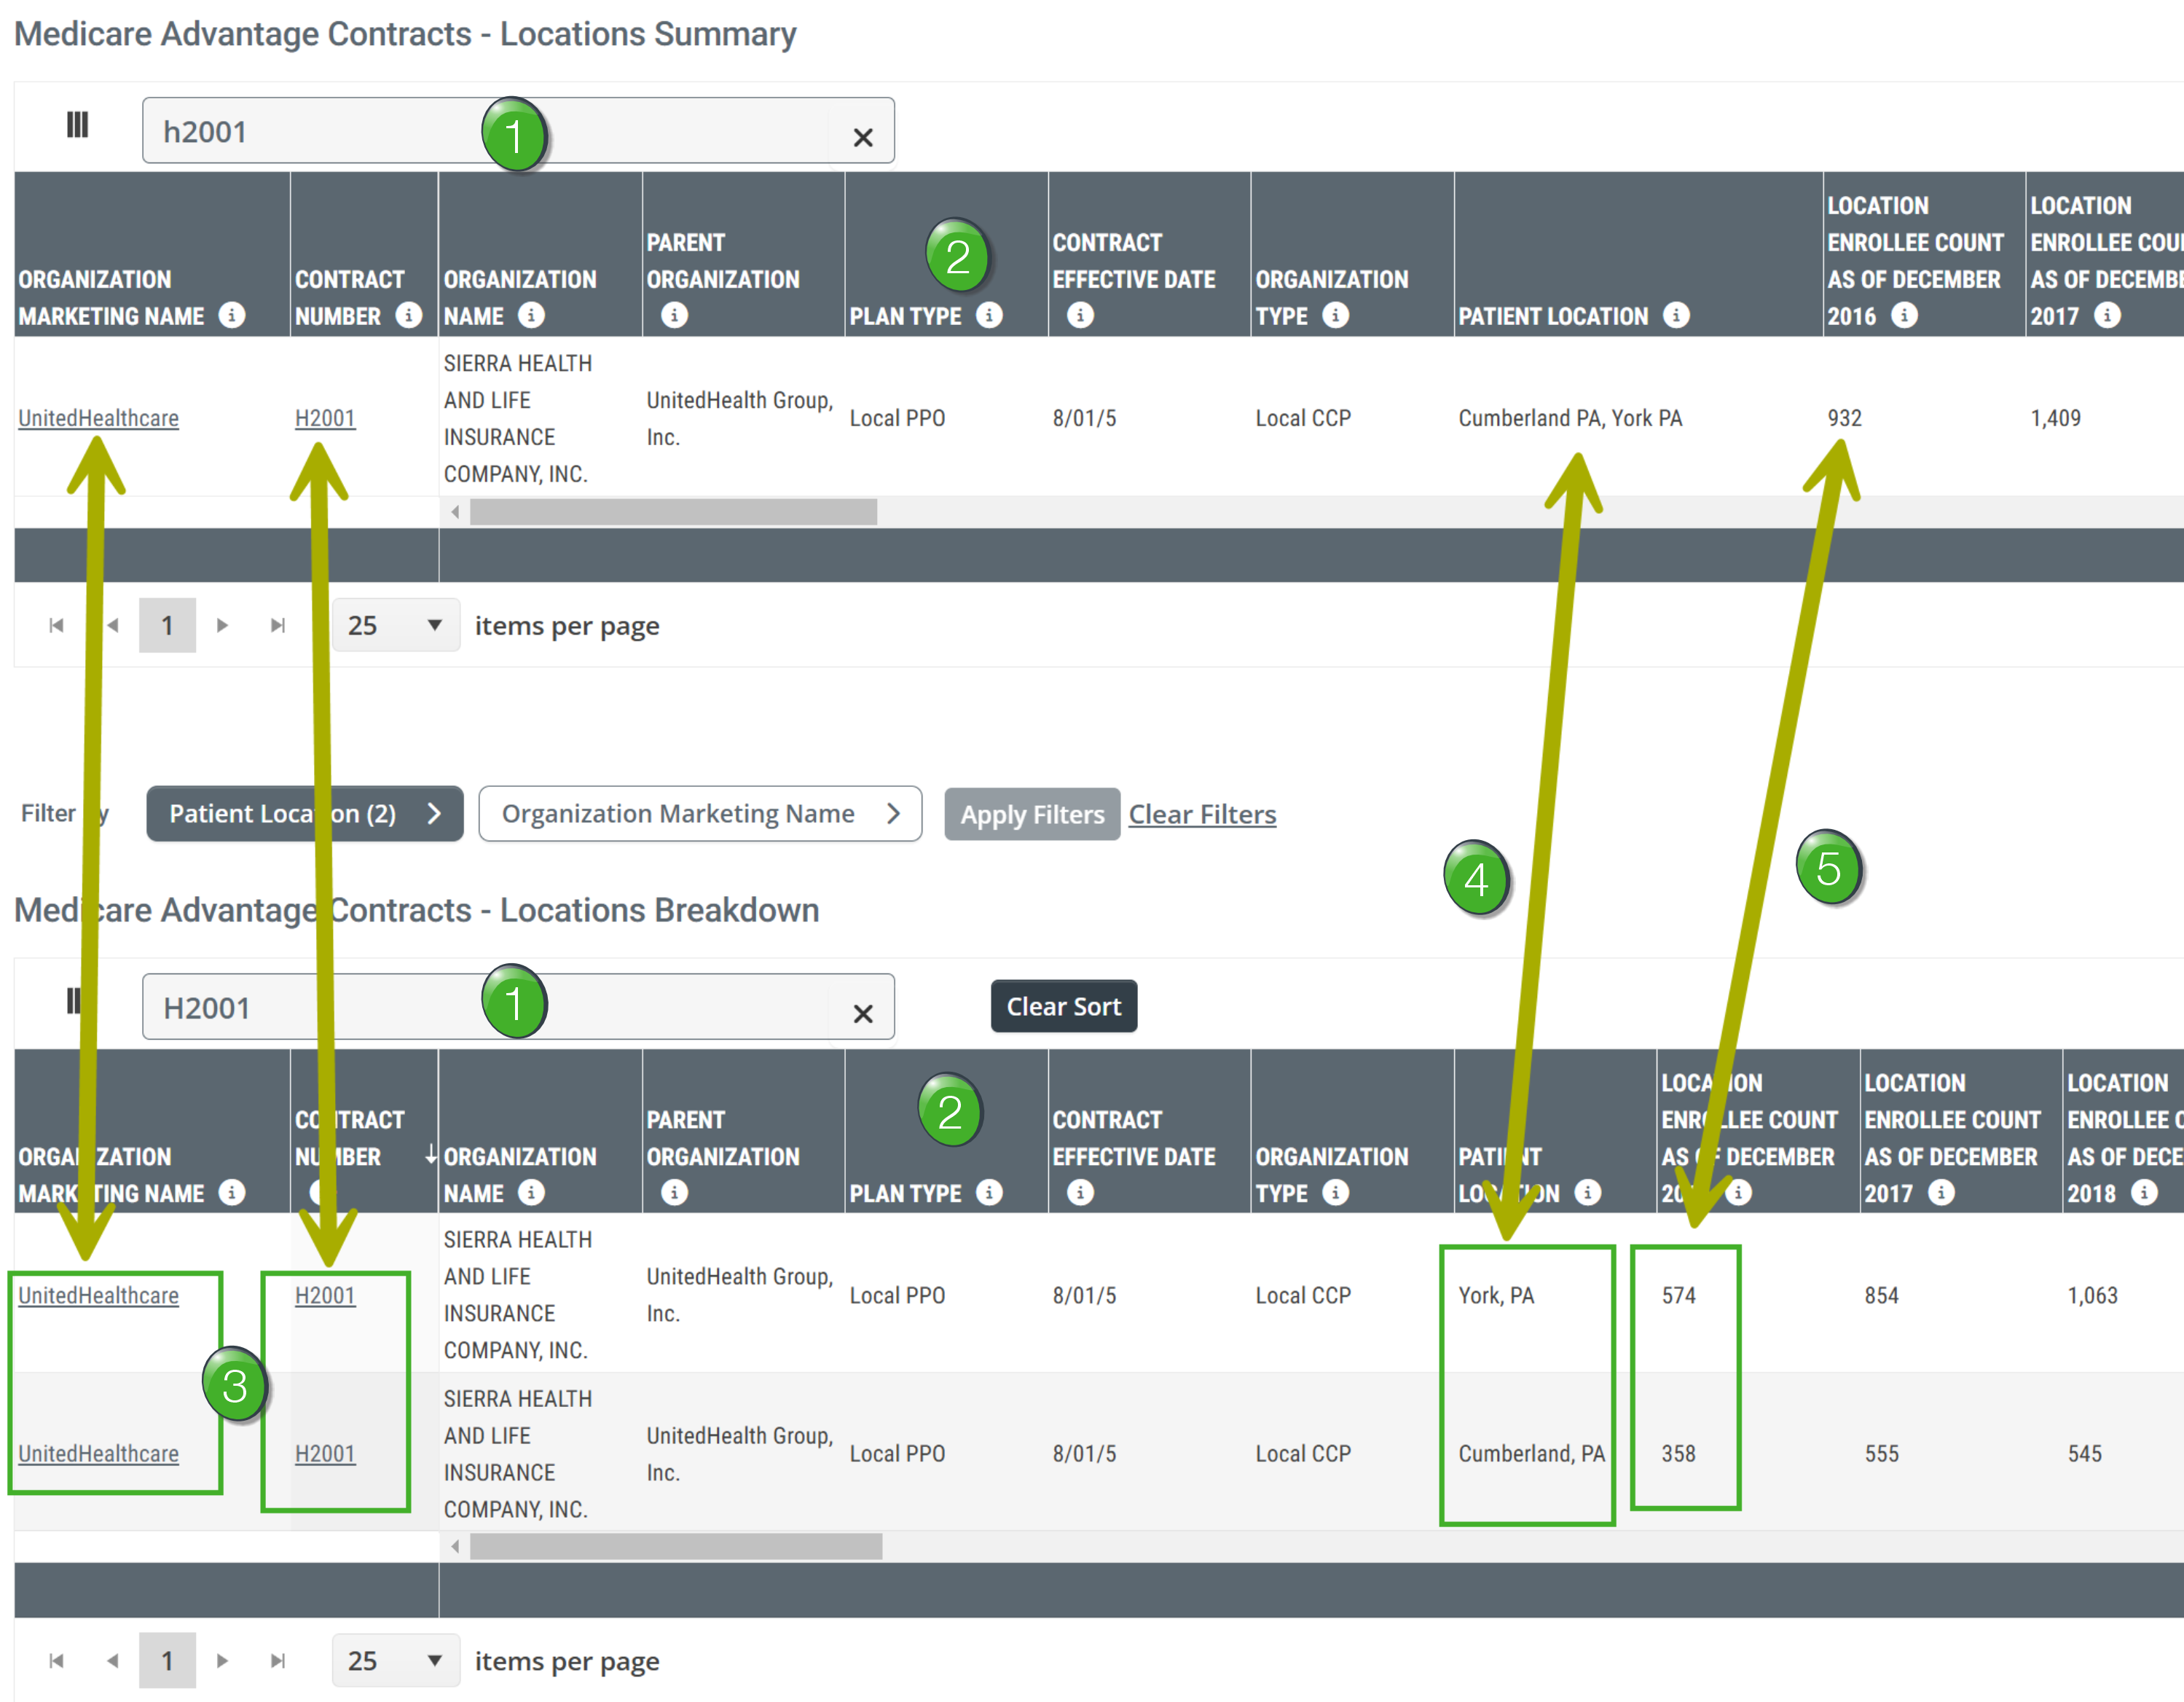
![]() Both tables show enrollee metrics organized by location and MA Contract
Both tables show enrollee metrics organized by location and MA Contract
![]() Filter and Search Settings - To make the comparison easier to visualize, we set the same location, two counties in Pennsylvania and searched for a specific Contract Number - H2001. Only metrics pertaining to that single contract in our chosen locations will appear in the tables.
Filter and Search Settings - To make the comparison easier to visualize, we set the same location, two counties in Pennsylvania and searched for a specific Contract Number - H2001. Only metrics pertaining to that single contract in our chosen locations will appear in the tables.
![]() Because of the way these tables work, in order to use them together, it is imperative that you set the same "Patient Location" filters and table search for each."
Because of the way these tables work, in order to use them together, it is imperative that you set the same "Patient Location" filters and table search for each."
![]() Metrics - The metrics (columns) in each table are identical. We will describe the metrics below. See Understanding the Metrics.
Metrics - The metrics (columns) in each table are identical. We will describe the metrics below. See Understanding the Metrics.
![]() Organization/Contract - because we searched for H2001, the rows displayed in the tables will include metrics for that specific organization/contract. The "Locations Summary" shows one row of metrics. The "Locations Breakdown" has two rows of metrics
Organization/Contract - because we searched for H2001, the rows displayed in the tables will include metrics for that specific organization/contract. The "Locations Summary" shows one row of metrics. The "Locations Breakdown" has two rows of metrics
![]() Locations - In short, the difference between the two tables is how metrics for locations are displayed
Locations - In short, the difference between the two tables is how metrics for locations are displayed
- The "Locations Summary" table shows metrics for combined locations for the selected contract. Metrics for the combined locations are shown in a single row. Thus, the Location column shows "Cumberland PA, York, PA."
- The "Locations Breakdown" shows a row of metrics for each county chosen. Since we chose two counties in Pennsylvania, there are two rows in the table for Contract H2001.
![]() Metrics - Here is the proof. 574 + 358 = 932. The metrics in the separate rows in the "Locations Breakdown" table will add up to the combined counts in the "Locations Summary" table.
Metrics - Here is the proof. 574 + 358 = 932. The metrics in the separate rows in the "Locations Breakdown" table will add up to the combined counts in the "Locations Summary" table.
 Conclusions
- The "Locations Summary" (top) table shows combined metrics which will be more useful for making comparisons between two different MA Contracts.
- The "Locations Breakdown" (bottom) table shows metrics for the same contract with metrics displayed for the different states or counties set with the filter.
![]() Because of the way these tables work, in order to use them together, it is imperative that you set the same "Patient Location" filters for each."
Because of the way these tables work, in order to use them together, it is imperative that you set the same "Patient Location" filters for each."
Understanding the Metrics
The two tables on the Medicare Advantage Contracts Report page each have five sections of metrics.
 |
|
 |
|
 |
|
 |
|
 |
The metrics in each section are described below.
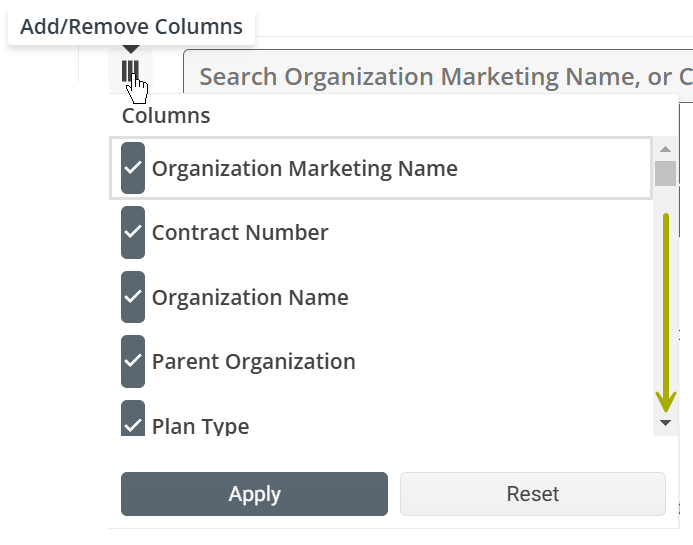
![]() In order to focus on what you want, you can hide any columns from the table by clicking on the Add/Remove column icon
In order to focus on what you want, you can hide any columns from the table by clicking on the Add/Remove column icon ![]() at the top left of the table.
at the top left of the table.
Just for fun, here is an image of all of the metrics as they appear in the tables on the Medicare Advantage Contracts page.

The breadth of this table is daunting, but let's look at the logical sections, one by one.
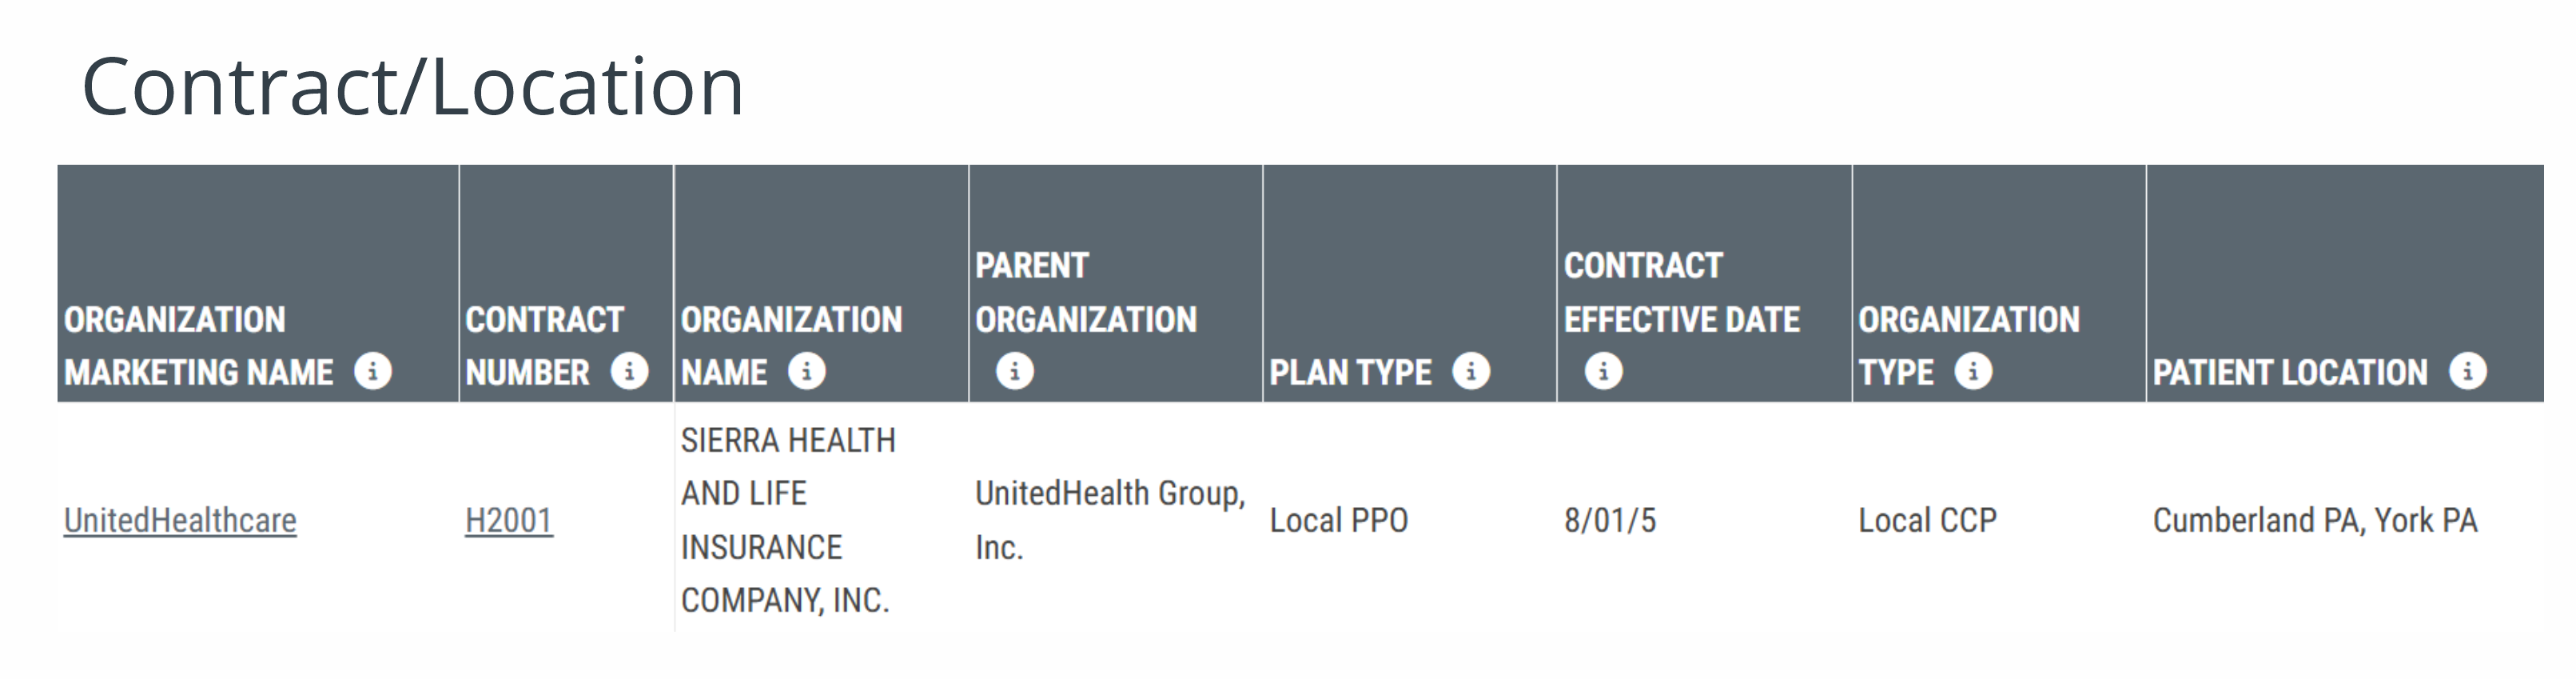
Contract/Location Information
The first eight columns identify the contract in detail and show the chosen region from which the patients live for whom the metrics in the remaining columns will be counted.
 Column Definitions
Column name |
Definition |
| Organization Marketing Name | The organization name. The name by which the beneficiaries would recognize the organization |
| Contract Number | The contract identifier from the CMS Enrollment file |
| Organization Name | The name of the organization from the CMS Enrollment file |
| Parent Organization | The name of the parent organization for this contract |
| Plan Type | The type of plan offered to beneficiaries |
| Contract Effective Date | The date the contract began with CMS |
| Organization Type | The type of contract held by the organization with CMS |
| Patient Location | The chosen location(s) where the beneficiaries of the listed contract live. This is the region set by the filters for each table |
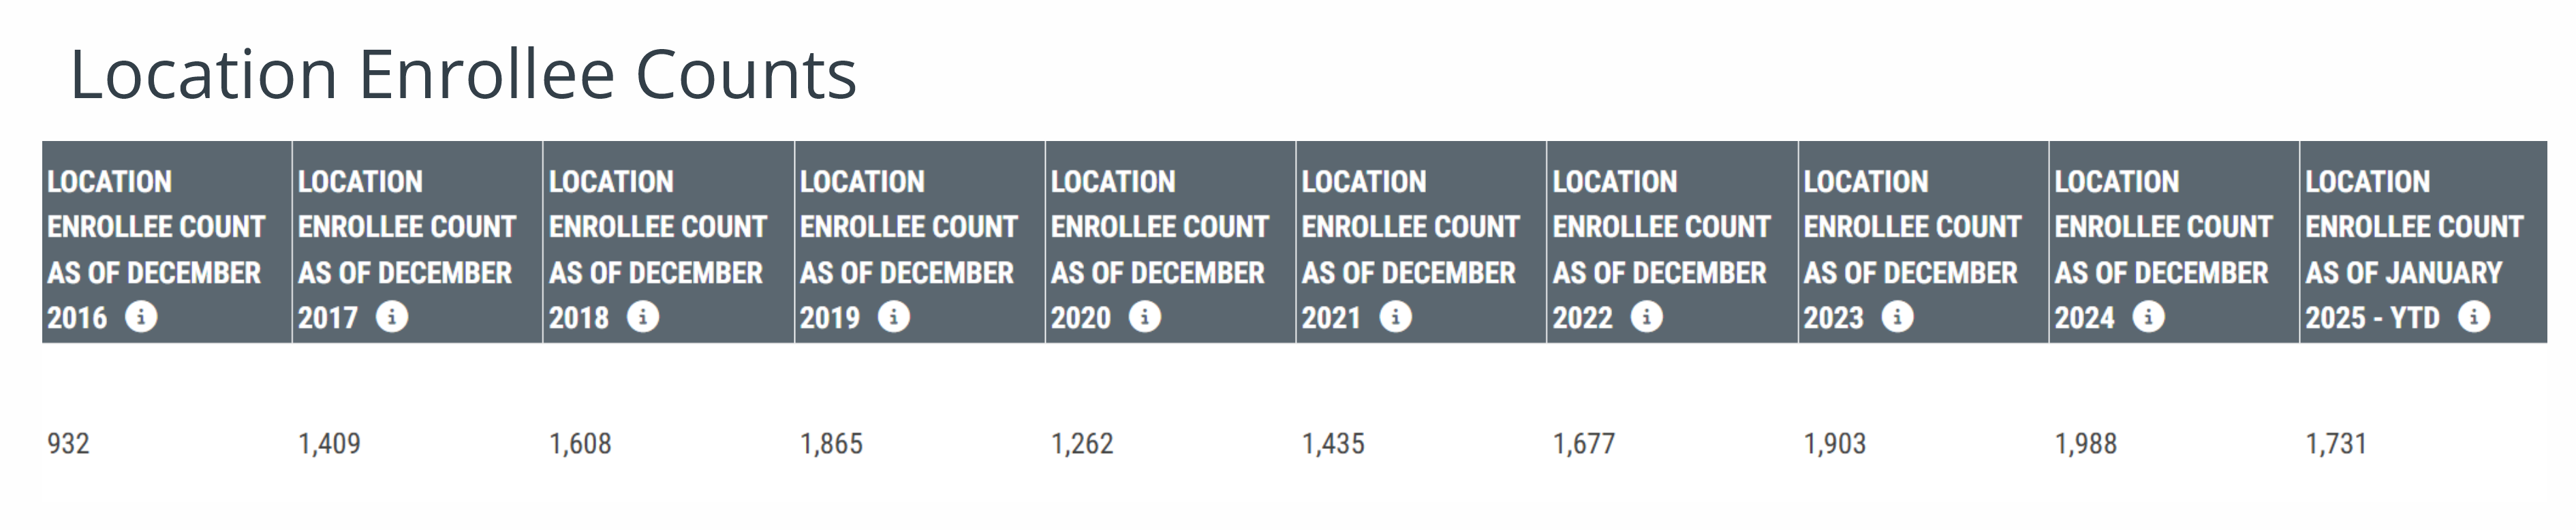
Location Enrollee Counts
This section of metrics includes trended enrollee counts for the listed contract who reside in the selected patient location(s) spanning ten years.
![]() Each column will show the count of enrollees as of the month listed in the header in the column header. The count is specific to the contract listed in the row and to the region set in the filter.
Each column will show the count of enrollees as of the month listed in the header in the column header. The count is specific to the contract listed in the row and to the region set in the filter.
![]() The reporting period for these metrics is not a count during the listed year. Instead, the count is as of the month listed.
The reporting period for these metrics is not a count during the listed year. Instead, the count is as of the month listed.
![]() For the specific contract and selected region, you will be able to see trends of enrollees of the contract listed in the row for the region set in the filters. Growth or decline?
For the specific contract and selected region, you will be able to see trends of enrollees of the contract listed in the row for the region set in the filters. Growth or decline?
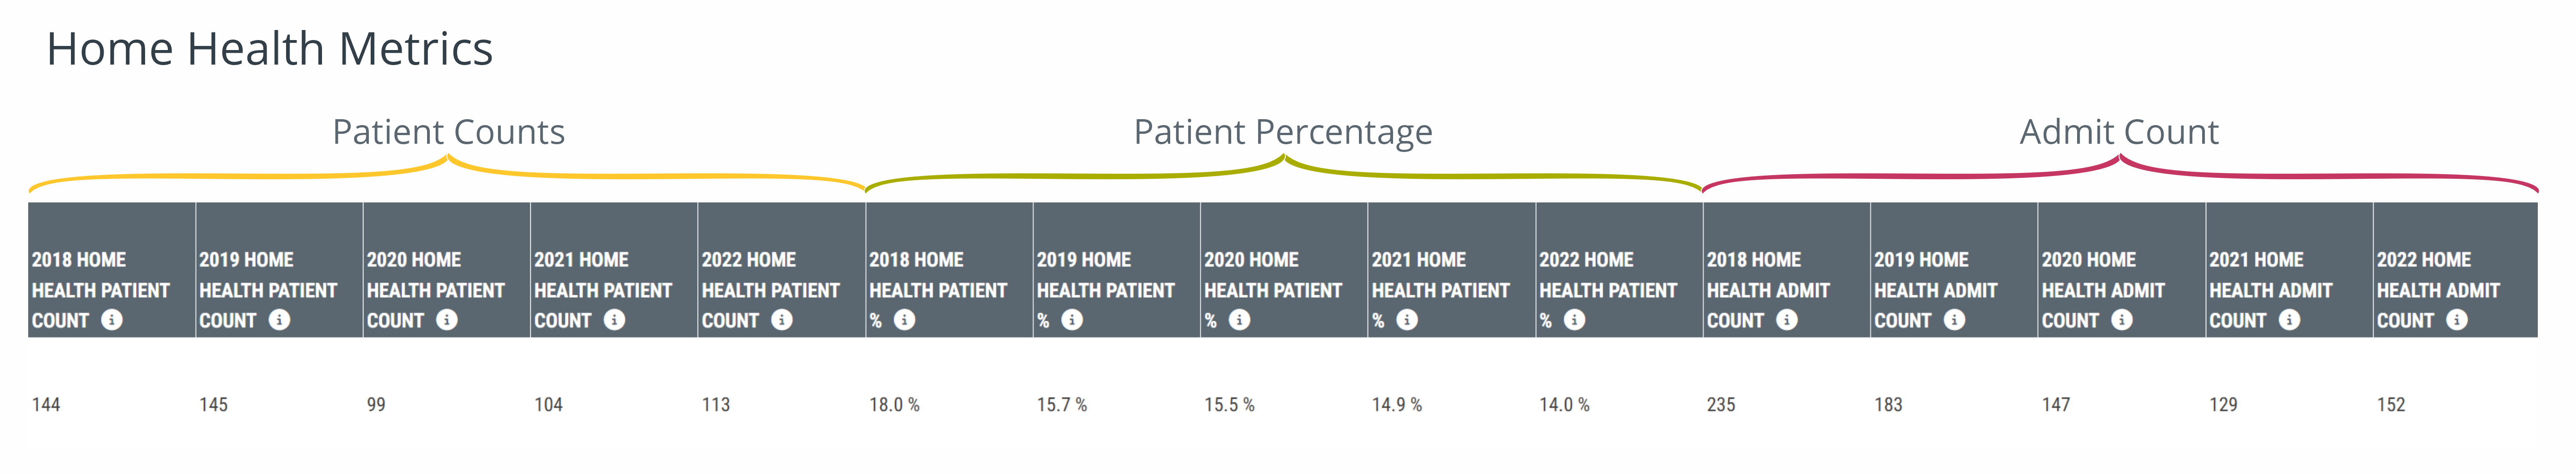
Home Health Metrics
Fifteen metrics, displayed in three sections, are specific to home health agencies.
![]() For each section, five years of trended metrics are shown.
For each section, five years of trended metrics are shown.
Section Definitions
| Metric | Definition |
| 20XX Home Health Patient Count | The number in this column is the count of distinct patients who were enrolled with the MA contract listed in the row and lived in the selected location who received home health care during the 20XX calendar year |
| 20XX Home Health Patient % |
For patients who were enrolled with the MA contract listed in the row and lived in the selected location, the metric in this column is the percentage of those patients who received home health care during the year listed in the header |
|
|
|
| 20XX Home Health Admit Count | The number in this column is the count of home health admits who were enrolled with the MA contract listed in the row and who lived in the selected location during the 20XX calendar year |

![]() Details
Details
- Since distinct patients can be admitted to home health care more than one time in a year, the count of admits should be higher than the distinct patient count
- Metrics for the most recent year will be Year to Date (YTD): January through the end of the current reporting period
- You can see how the Home Health Patient percentage is calculated by looking at the columns with the numerator and denominator shown in the table.
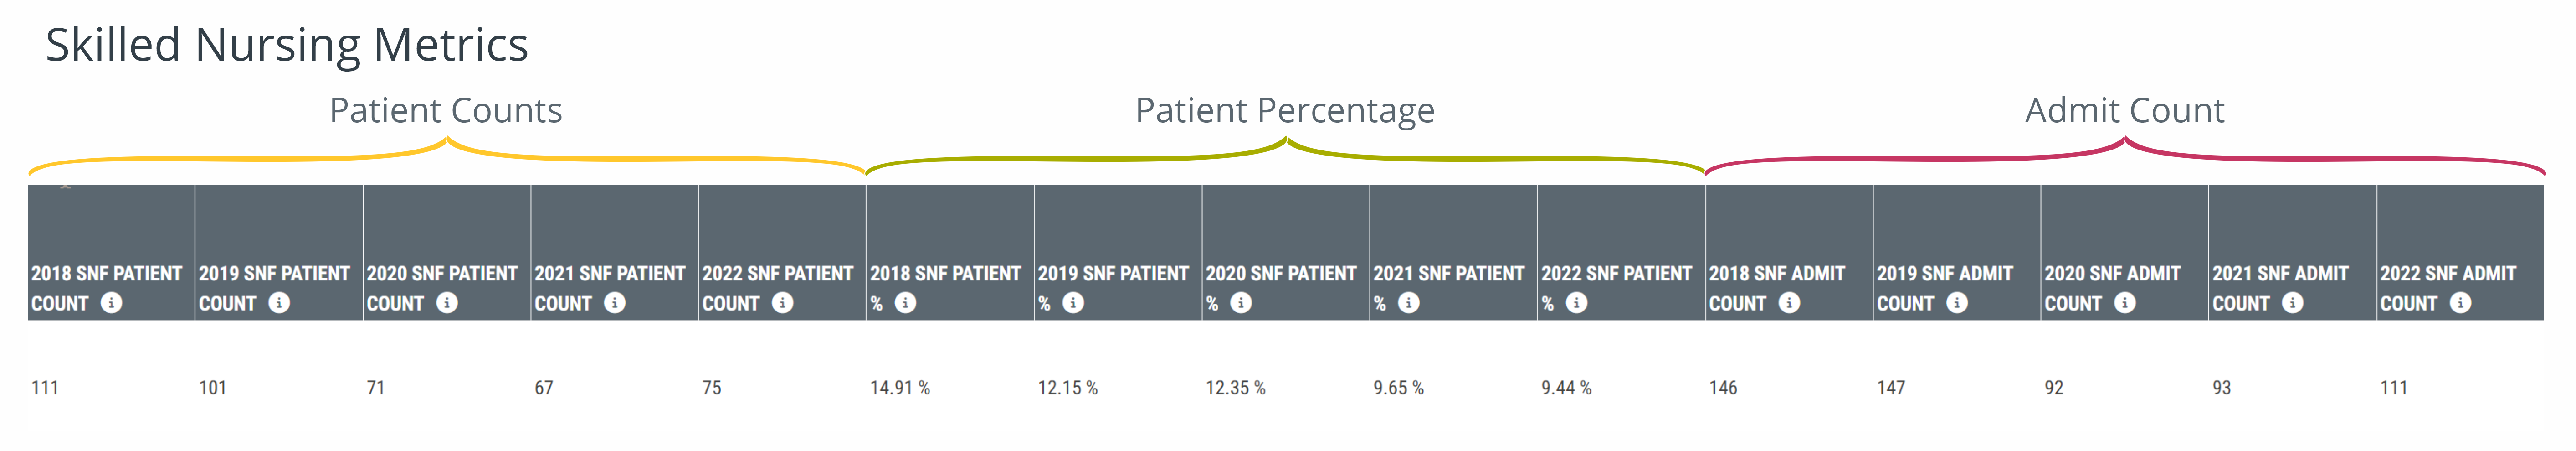
Skilled Nursing Metrics
Fifteen metrics, displayed in three sections, are specific to skilled nursing facilities.
![]() For each section, five years of trended metrics are shown.
For each section, five years of trended metrics are shown.
Section Definitions
| Metric | Definition |
| 20XX SNF Patient Count | The number in this column is the count of distinct patients who were enrolled with the MA contract listed in the row and lived in the selected location who received skilled nursing care during the 20XX calendar year |
| 20XX SNF Patient % |
For patients who were enrolled with the MA contract listed in the row and lived in the selected location, the metric in this column is the percentage of those patients who received skilled nursing care during the year listed in the header |
|
|
|
| 20XX SNF Admit Count | The number in this column is the count of home health admits who were enrolled with the MA contract listed in the row and who lived in the selected location during the 20XX calendar year |

![]() Details
Details
- Since distinct patients can be admitted to skilled nursing care more than one time in a year, the count of admits should be higher than the distinct patient count
- Metrics for the most recent year will be Year to Date (YTD): January through the end of the current reporting period
- You can see how the SNF Patient percentage is calculated by looking at the columns with the numerator and denominator shown in the table
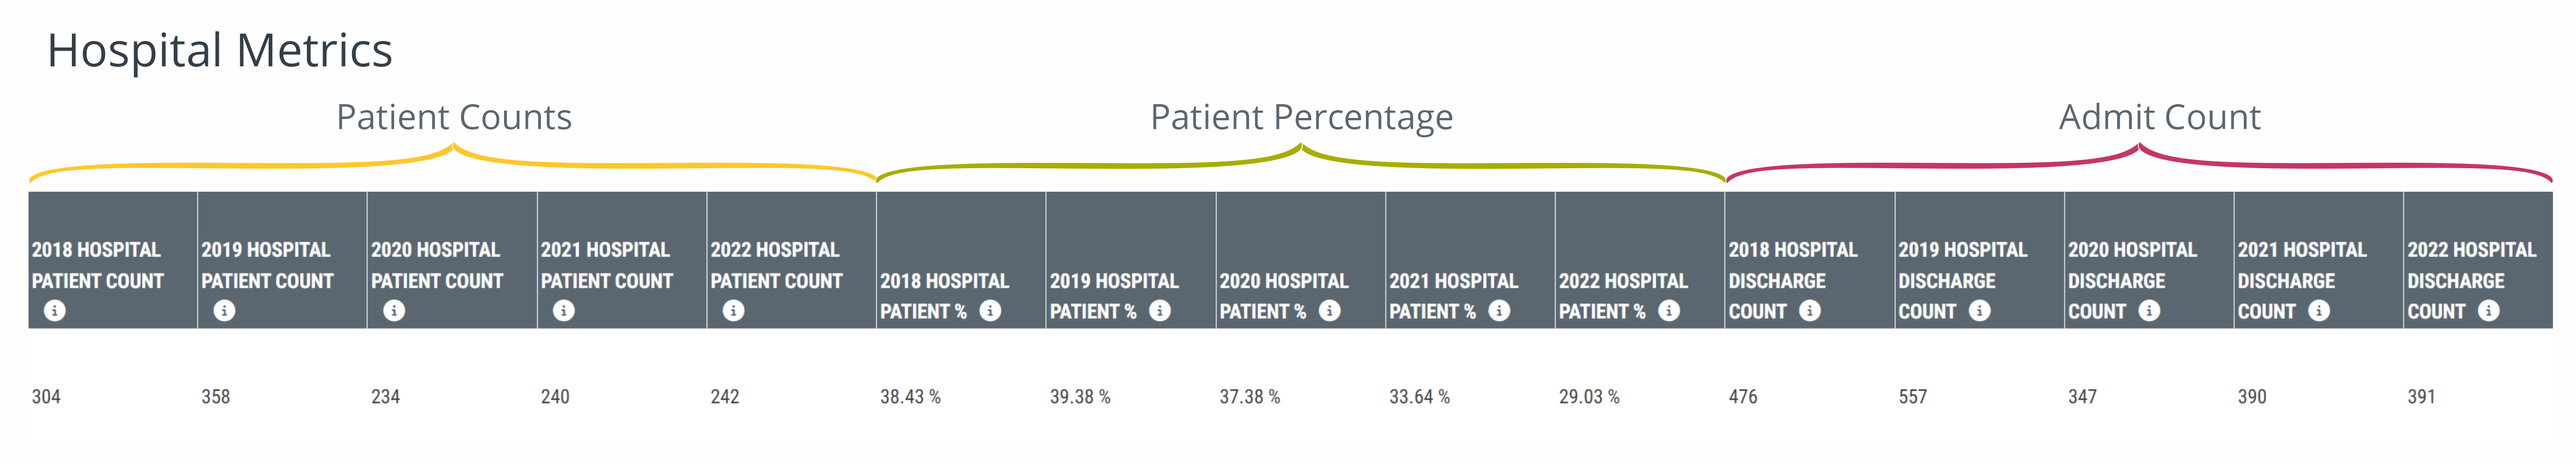
Hospital Metrics
Fifteen metrics, displayed in three sections, are specific to hospitals.
![]() For each section, five years of trended metrics are shown.
For each section, five years of trended metrics are shown.
Section Definitions
| Metric | Definition |
| 20XX Hospital Patient Count | The number in this column is the count of distinct patients who were enrolled with the MA contract listed in the row and lived in the selected location who were discharged from hospital care during the 20XX calendar year |
| 20XX Hospital Patient % |
For patients who were enrolled with the MA contract listed in the row and lived in the selected location, the metric in this column is the percentage of those patients who were discharged from hospital care during the year listed in the header |
|
|
|
| 20XX Hospital Discharge Count | The number in this column is the count of hospital discharges who were enrolled with the MA contract listed in the row and who lived in the selected location during the 20XX calendar year |

![]() Details
Details
- Since distinct patients can be discharged from hospital care more than one time in a year, the count of discharges should be higher than the distinct patient count
- Metrics for the most recent year will be Year to Date (YTD): January through the end of the current reporting period
- You can see how the Hospital Patient percentage is calculated by looking at the columns with the numerator and denominator shown in the table
Contract Details
Page Overview
Each contract listed in the tables of the Medicare Advantage Contracts report page has a link to a details page for that contract
In each row, the name and the contract number are links to the detail page. Click the link to open the detail page for the contract named.
Use the following image to familiarize yourself with the basics of the Contract Details page
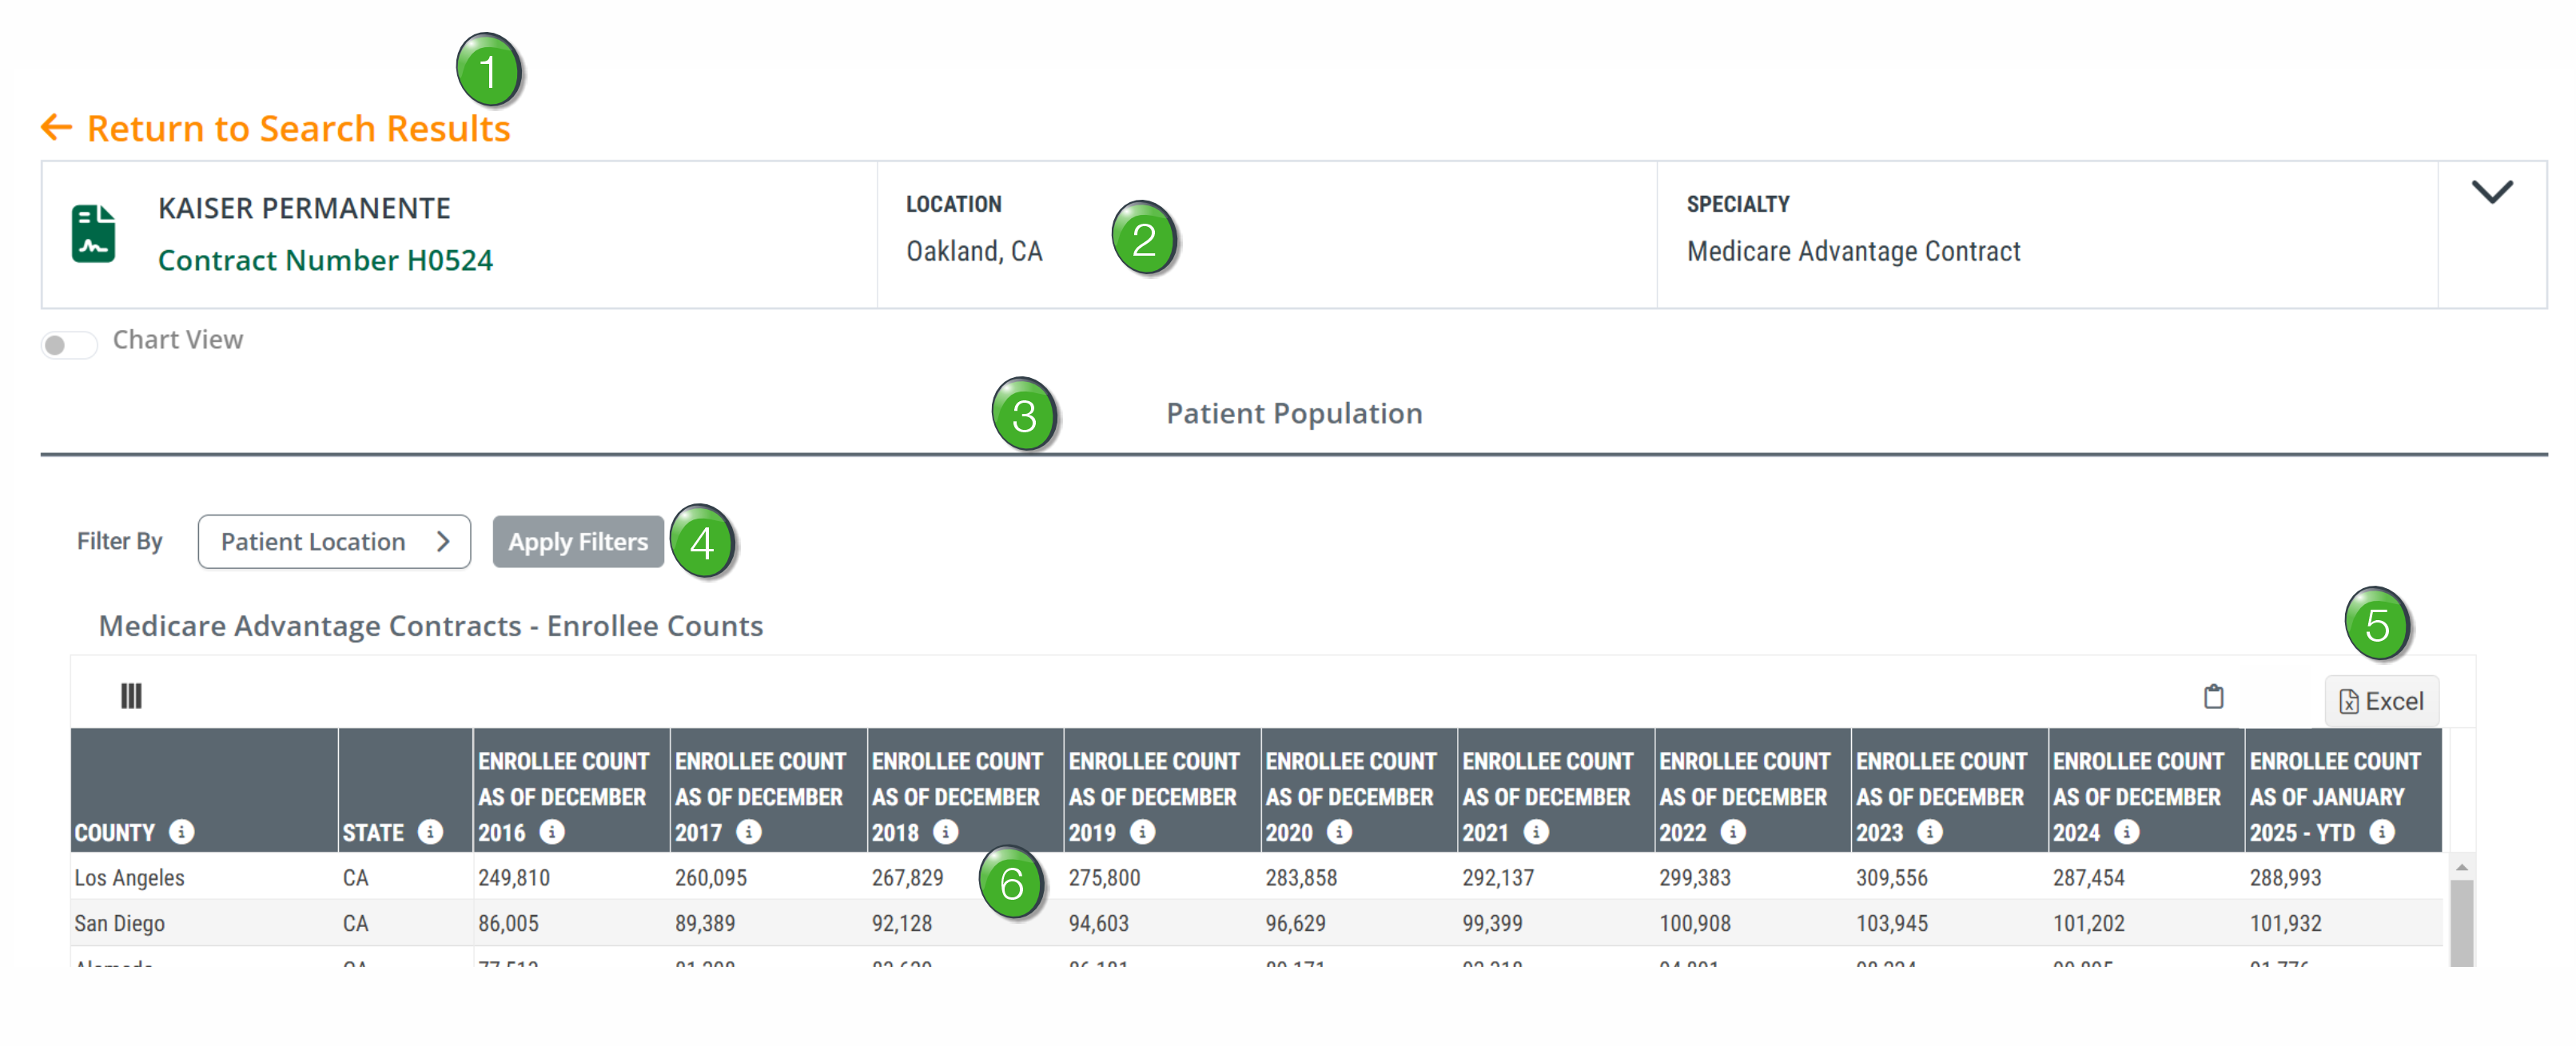
![]() Go back - Click on the "Return to Search Results" link to go back to the main Medicare Advantage Contracts reports page.
Go back - Click on the "Return to Search Results" link to go back to the main Medicare Advantage Contracts reports page.
![]() Contract Information - The top panel has useful identifying information about the selected contract. Click on the chevron
Contract Information - The top panel has useful identifying information about the selected contract. Click on the chevron ![]() at the top right of the panel to open the full panel. (See image)
at the top right of the panel to open the full panel. (See image)

![]() Contract Details page tabs - There are two tabs on the Contract Details page, Insights and Patient Population.
Contract Details page tabs - There are two tabs on the Contract Details page, Insights and Patient Population.
- The Insights tab contains some charts that show important trends in the metrics for the selected contract.
- The Patient Population tab has four tables of metrics which are described in detail below
![]() The Insights tab is Coming Soon!
The Insights tab is Coming Soon!
![]() Patient Location Filter - Using the patient location filter allows you to limit the metrics in the table below the filter to patients who live in your selected region.
Patient Location Filter - Using the patient location filter allows you to limit the metrics in the table below the filter to patients who live in your selected region.
![]() For details on using the patient population filter, see Setting the Filters, above.
For details on using the patient population filter, see Setting the Filters, above.
![]() Excel Export - If you want to export the metrics in the table so you can examine the metrics using the spreadsheet tools in Excel, click the "Excel" button
Excel Export - If you want to export the metrics in the table so you can examine the metrics using the spreadsheet tools in Excel, click the "Excel" button ![]() . The contents of the table will be downloaded and will be available in your download folder.
. The contents of the table will be downloaded and will be available in your download folder.
![]() Table Content - Detailed metrics are included in one of the four tables displayed on the page. The metrics will reflect any patient population filters you set for each table.
Table Content - Detailed metrics are included in one of the four tables displayed on the page. The metrics will reflect any patient population filters you set for each table.
Medicare Advantage Contracts - Enrollee Counts
![]() As the table name implies, the metrics in this table are trended enrollee counts for the location identified in first column for ten years for the selected Medicare Advantage Contract.
As the table name implies, the metrics in this table are trended enrollee counts for the location identified in first column for ten years for the selected Medicare Advantage Contract.
Use the following image to become familiar with the basics.
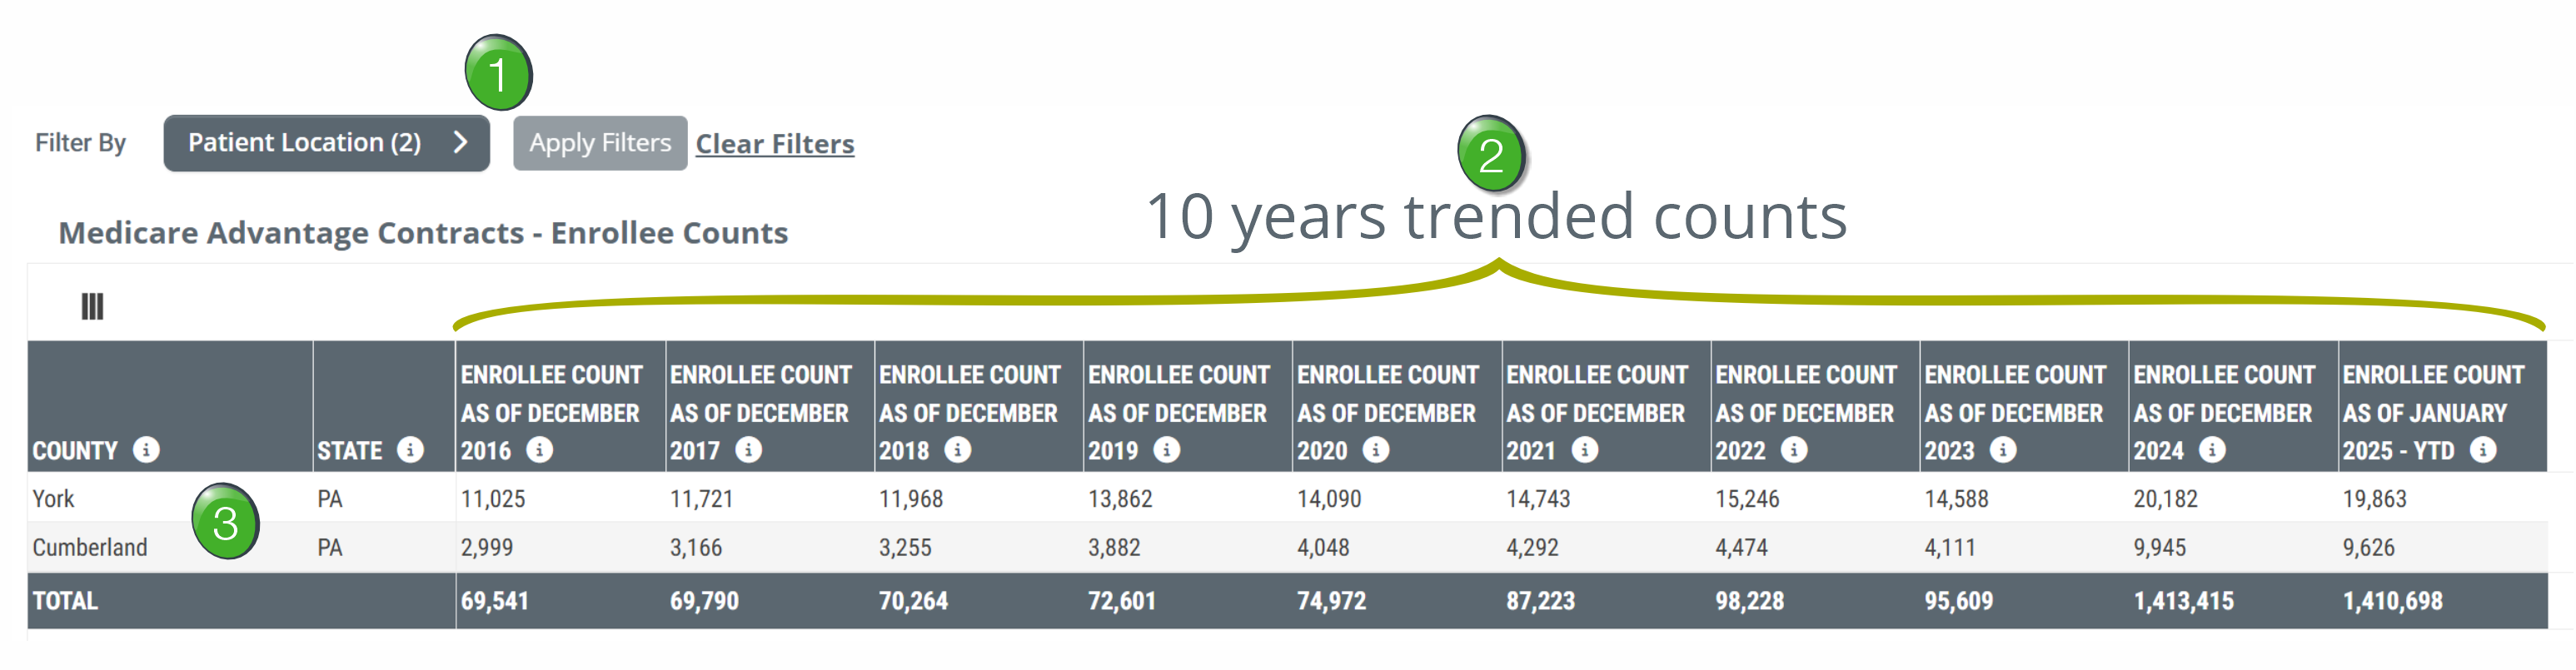
![]() Patient Location Filter - Using the patient location filter allows you to limit the metrics in the table below the filter to patients who live in your selected region.
Patient Location Filter - Using the patient location filter allows you to limit the metrics in the table below the filter to patients who live in your selected region.
![]() For details on using the patient population filter, see Setting the Filters, above.
For details on using the patient population filter, see Setting the Filters, above.
![]() Trended Enrollee counts - The table shows ten years of enrollee counts for patients who lived in the listed county as of the month listed in the header.
Trended Enrollee counts - The table shows ten years of enrollee counts for patients who lived in the listed county as of the month listed in the header.
![]() This metric is not a count of patients enrolled during the listed year. It is a count of patients enrolled during the listed month (December or January).
This metric is not a count of patients enrolled during the listed year. It is a count of patients enrolled during the listed month (December or January).
![]() Trends - The power of this table is that you can specify a region for the selected MA contract and quickly get a sense of the growth or decline of patient enrollment.
Trends - The power of this table is that you can specify a region for the selected MA contract and quickly get a sense of the growth or decline of patient enrollment.
![]() Locations - The table shows the breakdown of enrollees by the territories selected with the Patient Population filter.
Locations - The table shows the breakdown of enrollees by the territories selected with the Patient Population filter.
Medicare Advantage Contracts - Home Health Utilization
![]() This table shows three trended metrics for home health patients in the selected regions from patients enrolled in the selected MA Contract.
This table shows three trended metrics for home health patients in the selected regions from patients enrolled in the selected MA Contract.
Use the following image to become familiar with the basics.
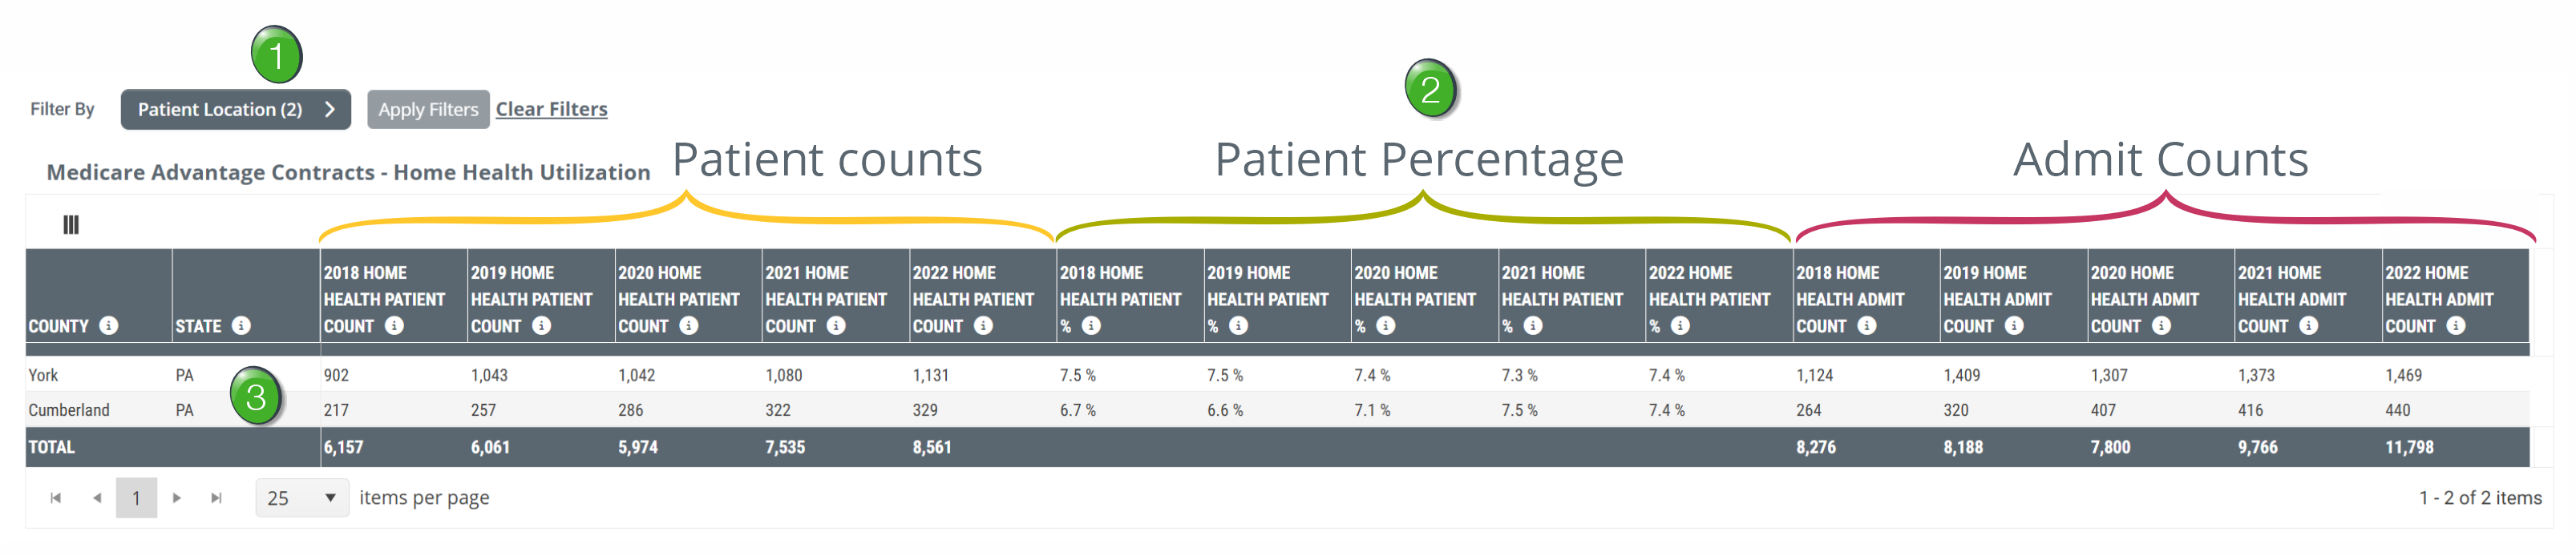
![]() Patient Location Filter - Using the patient location filter allows you to limit the metrics in the table below the filter to patients who live in your selected region.
Patient Location Filter - Using the patient location filter allows you to limit the metrics in the table below the filter to patients who live in your selected region.
![]() For details on using the patient population filter, see Setting the Filters, above.
For details on using the patient population filter, see Setting the Filters, above.
![]() Three Metrics - The table contains three sections of trended metrics shown over a five year period.
Three Metrics - The table contains three sections of trended metrics shown over a five year period.
| Metric | Definition |
|
20XX Home Health Patient Count (Five columns of year by year trended metrics) |
The numbers in these columns are counts of distinct patients who were enrolled with the selected MA contract who lived in the selected location who received home health care during the calendar year listed in the header |
|
20XX Home Health Patient % (Five columns of year by year trended metrics) |
For patients who were enrolled with the selected MA contract and lived in the selected location, the metrics in these columns are the percentages of those patients who received home health care during the year listed in the header |
|
|
|
|
20XX Home Health Admit Count (Five columns of year by year trended metrics) |
The numbers in these columns are counts of home health admits who were enrolled with the selected MA contract and who lived in the selected location during the 20XX calendar year |
![]() Locations - The table shows the breakdown of enrollees by the territories selected with the Patient Population filter.
Locations - The table shows the breakdown of enrollees by the territories selected with the Patient Population filter.
Medicare Advantage Contracts - Skilled Nursing Utilization
![]() This table shows three trended metrics for skilled nursing patients in the selected regions from patients enrolled in the selected MA Contract.
This table shows three trended metrics for skilled nursing patients in the selected regions from patients enrolled in the selected MA Contract.
Use the following image to become familiar with the basics.
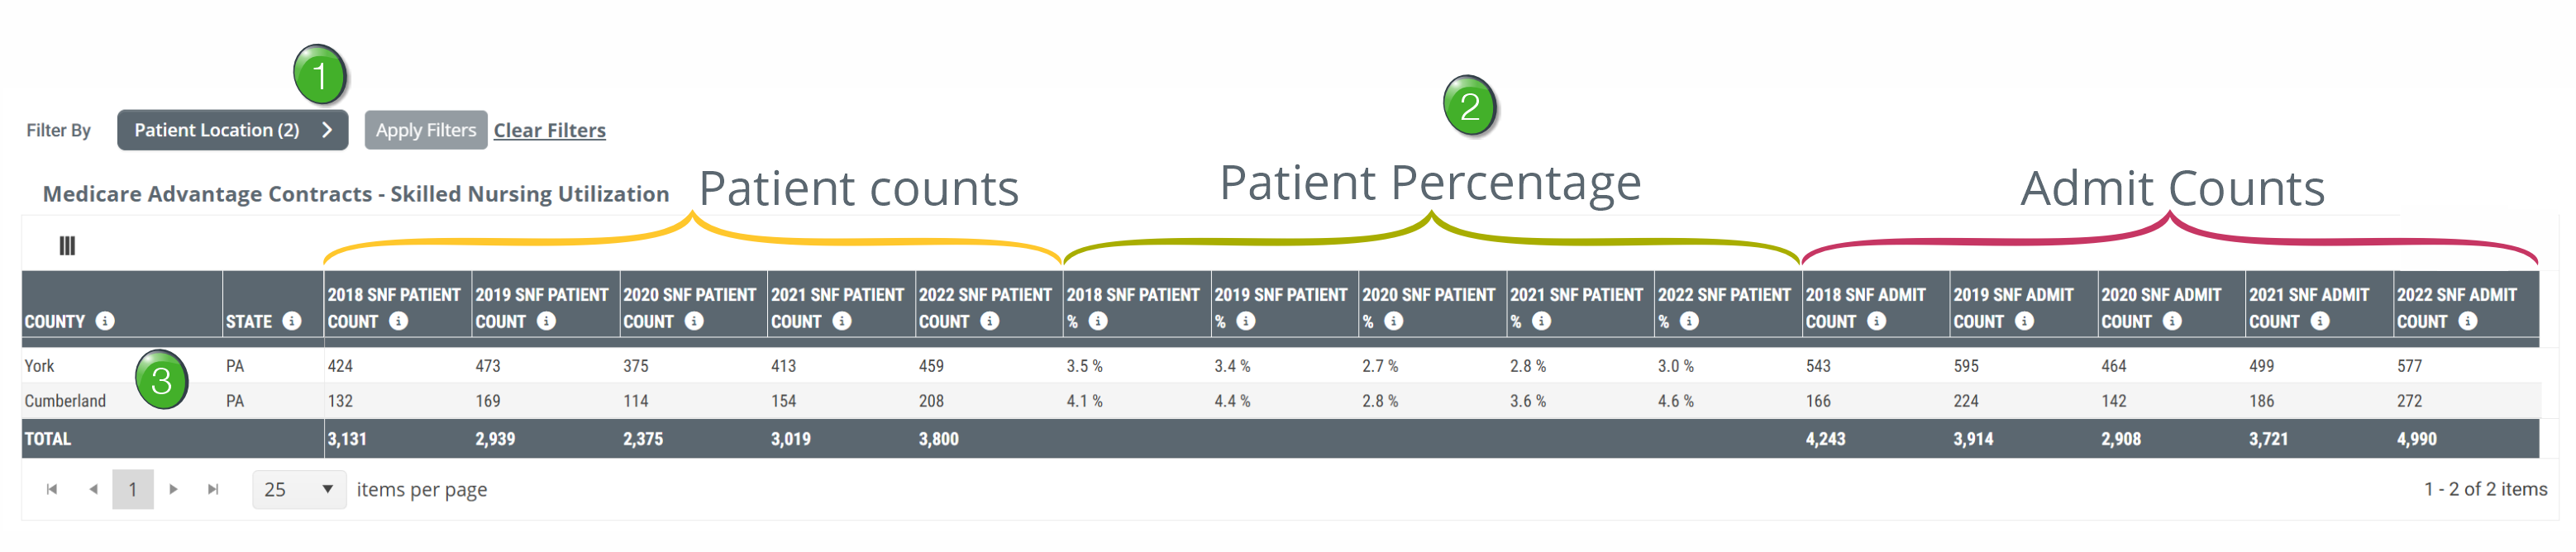
![]() Patient Location Filter - Using the patient location filter allows you to limit the metrics in the table below the filter to patients who live in your selected region.
Patient Location Filter - Using the patient location filter allows you to limit the metrics in the table below the filter to patients who live in your selected region.
![]() For details on using the patient population filter, see Setting the Filters, above.
For details on using the patient population filter, see Setting the Filters, above.
![]() Three Metrics - The table contains three sections of trended metrics shown over a five year period.
Three Metrics - The table contains three sections of trended metrics shown over a five year period.
| Metric | Definition |
|
20XX SNF Patient Count (Five columns of year by year trended metrics) |
The numbers in these columns are counts of distinct patients who were enrolled with the selected MA contract who lived in the selected location who received skilled nursing care during the calendar year listed in the header |
|
20XX SNF Patient % (Five columns of year by year trended metrics) |
For patients who were enrolled with the selected MA contract and lived in the selected location, the metrics in these columns are the percentages of those patients who received skilled nursing care during the year listed in the header |
|
|
|
|
20XX SNF Admit Count (Five columns of year by year trended metrics) |
The numbers in these columns are counts of skilled nursing admits who were enrolled with the selected MA contract and who lived in the selected location during the 20XX calendar year |
![]() Locations - The table shows the breakdown of enrollees by the territories selected with the Patient Population filter.
Locations - The table shows the breakdown of enrollees by the territories selected with the Patient Population filter.
Medicare Advantage Contracts - Hospital Utilization
![]() This table shows three trended metrics for hospital patients in the selected regions from patients enrolled in the selected MA Contract.
This table shows three trended metrics for hospital patients in the selected regions from patients enrolled in the selected MA Contract.
Use the following image to become familiar with the basics.
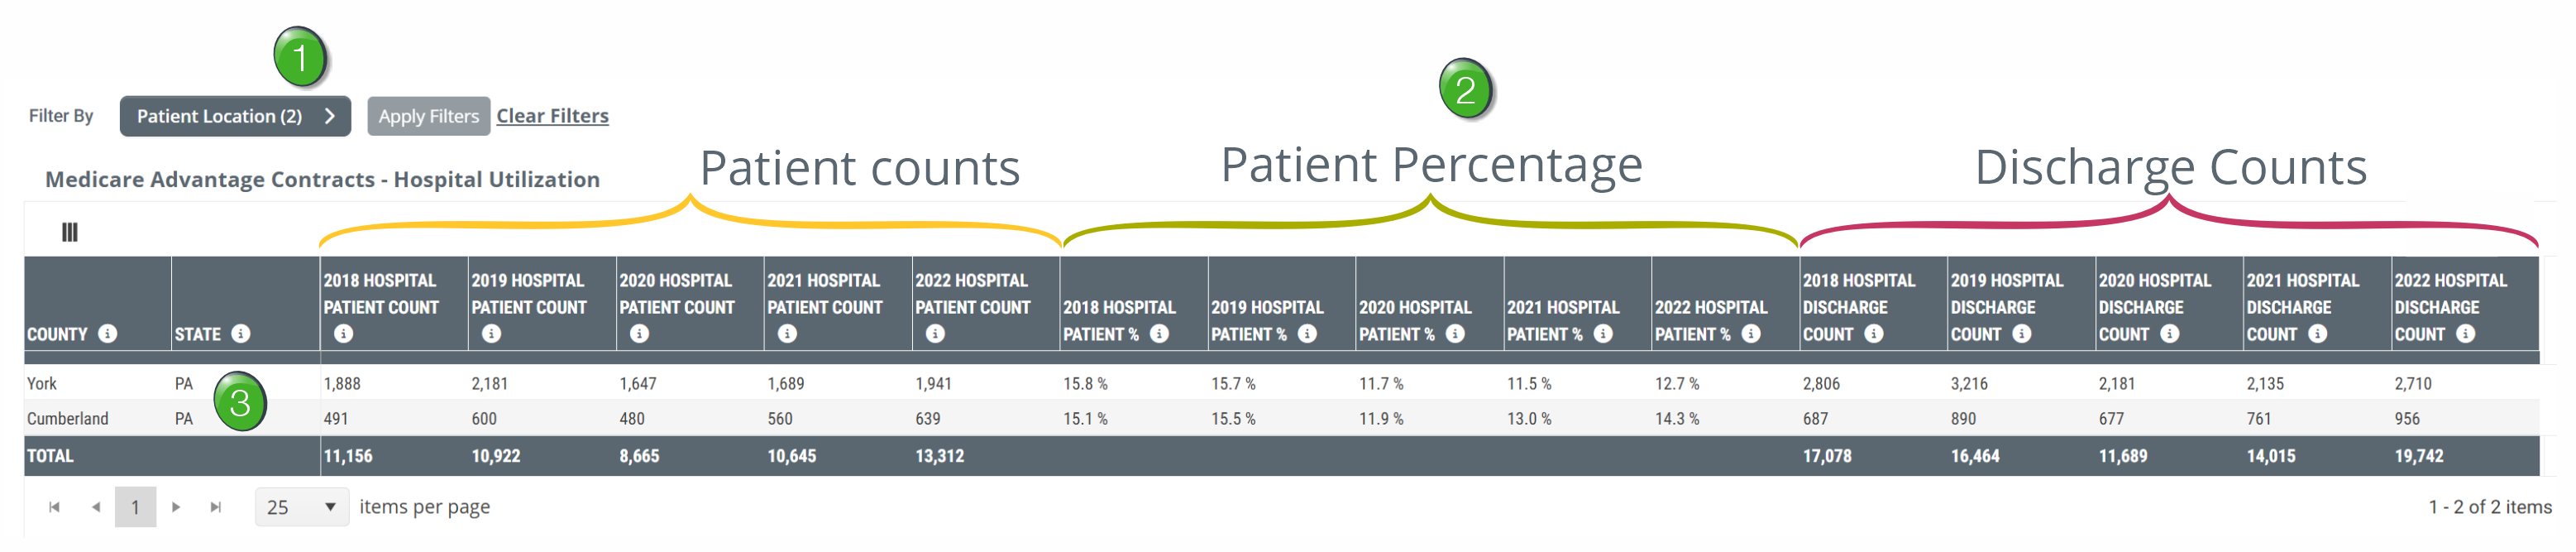
![]() Patient Location Filter - Using the patient location filter allows you to limit the metrics in the table below the filter to patients who live in your selected region.
Patient Location Filter - Using the patient location filter allows you to limit the metrics in the table below the filter to patients who live in your selected region.
![]() For details on using the patient population filter, see Setting the Filters, above.
For details on using the patient population filter, see Setting the Filters, above.
![]() Three Metrics - The table contains three sections of trended metrics shown over a five year period.
Three Metrics - The table contains three sections of trended metrics shown over a five year period.
| Metric | Definition |
|
20XX Hospital Patient Count (Five columns of year by year trended metrics) |
The numbers in these columns are the counts of distinct patients who were enrolled with the selected MA contract and lived in the selected location who were discharged from inpatient care during the 20XX calendar year |
|
20XX Hospital Patient % (Five columns of year by year trended metrics) |
For patients who were enrolled with the MA contract listed in the row and lived in the selected location, the metrics in these columns are the percentage of those patients who were discharged from inpatient care during the year listed in the header |
|
|
|
|
20XX Hospital Discharge Count (Five columns of year by year trended metrics) |
The numbers in these columns are the counts of hospital discharges who were enrolled with the MA contract listed in the row and who lived in the selected location during the 20XX calendar year |
![]() Locations - The table shows the breakdown of enrollees by the territories selected with the Patient Population filter.
Locations - The table shows the breakdown of enrollees by the territories selected with the Patient Population filter.
