Overview
This article pertains to the table: Home Health Destinations which is found on the Facility Analyze page for any hospital or SNF. There are two hospitalization metrics in the table, one that includes data compiled from claims for all patients treated by the home care agency in the row, on the left in the box in the image below. The metric to the right is different in that it is calculated using claims for patients who had been discharged from the facility for which this is the Analyze page, the selected facility.
![]() In most cases, the Facility Specific percent is higher than the other. Answering "why?" is the goal; but first, a summary of hospitalization.
In most cases, the Facility Specific percent is higher than the other. Answering "why?" is the goal; but first, a summary of hospitalization.
Summary of Hospitalization
Hospitalization is an event that we count from any time during a patient's stay at home care or during the 30 days after discharge. Any time a patient is admitted to any hospital during this period, we count that as a hospitalization event.
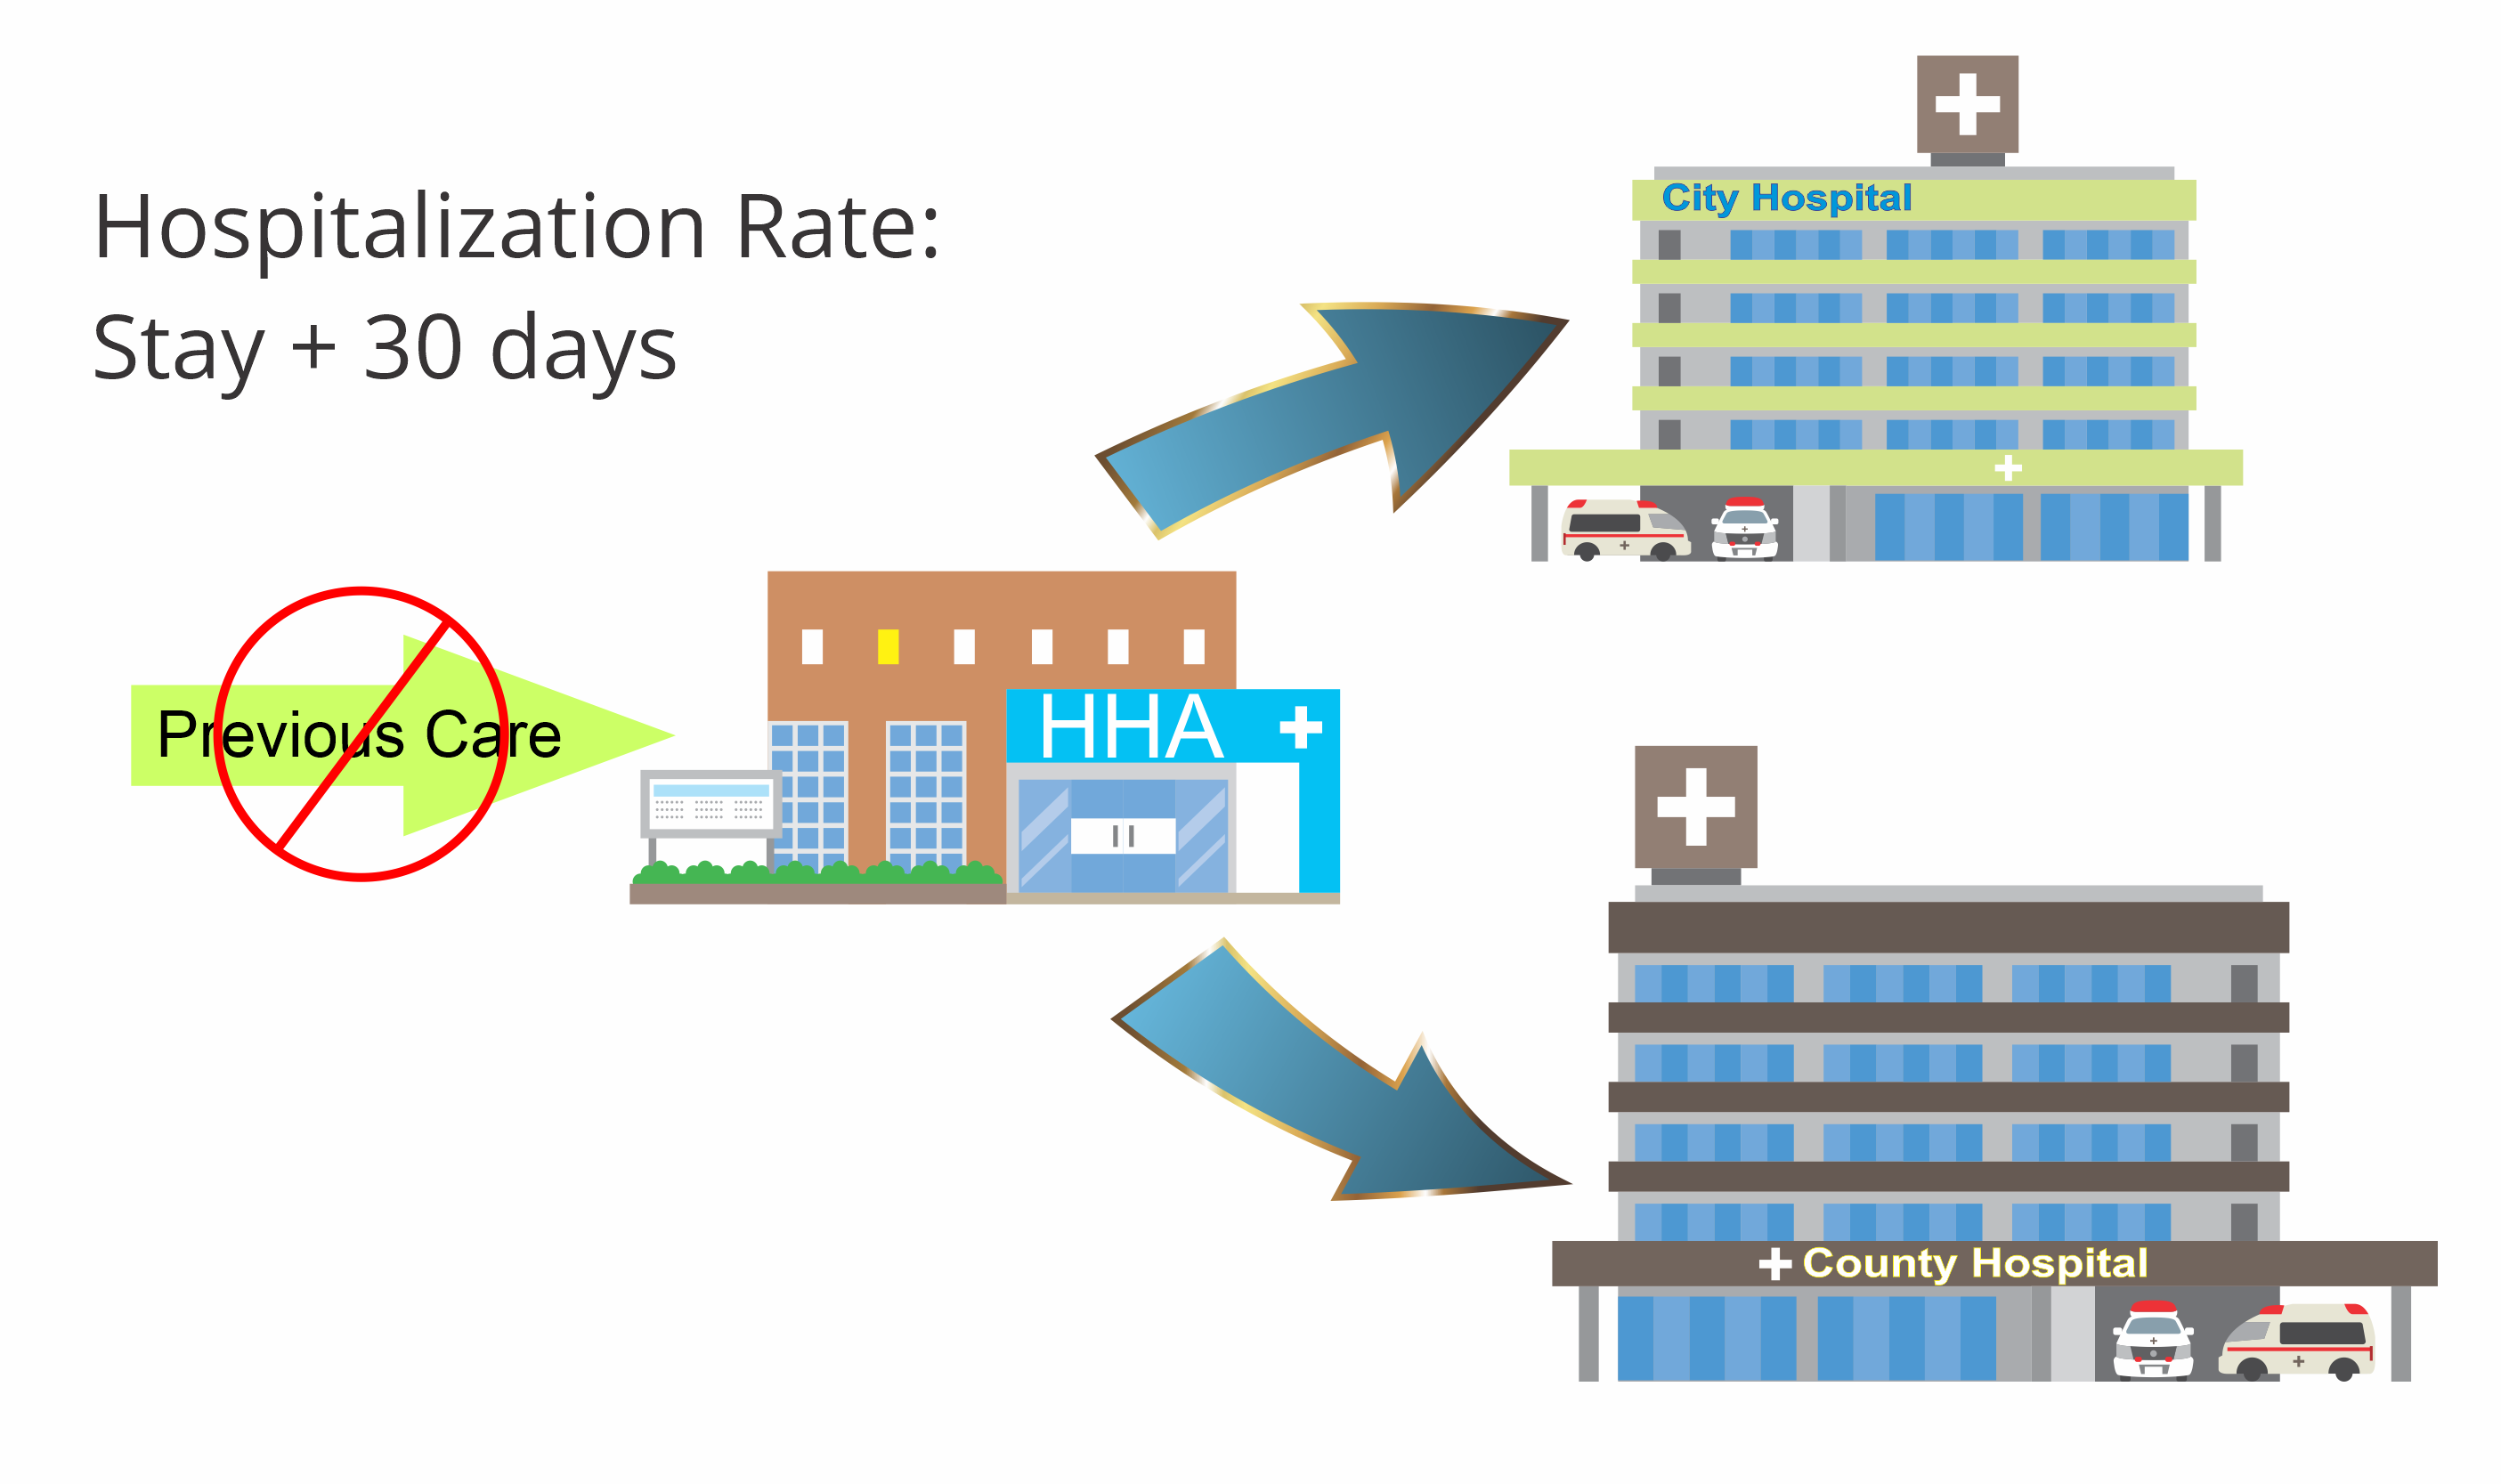
Hospitalization Rate: Stay + 30 Days
In this metric, and elsewhere in Marketscape, we do not consider any previous care provided prior to admission to home care when calculating hospitalization. The metric is simply a measure of what percentage of patients were treated at the home health agency who were admitted to a hospital. The patient does not need to be admitted to a specific hospital.
Facility Specific Hospitalization Rate
For the Facility Specific metric we only track hospitalizations for patients who were discharged from the selected facility on the Analyze page. The hospitalization could be to any hospital.
Why is the Facility Specific Metric so much Larger?
The Facility Specific metric is a subset of the more encompassing Hospitalization Rate: +30 Days metric. (See image) The higher percentage will reflect the differences in the patient population between the two metrics.
What is the difference between the two metrics
- Patient Acuity - For this metric, the general population of patients includes a broad spectrum of "pre" acute care situations. In contrast, an inpatient facility will discharge patients to home health care who have higher acuity, that is, the patients are more sick. This means that they are more likely to be returned to short term inpatient care when compared to the overall pool of patients admitted to home care. For more information, see Patient Acuity.
-
Frequent Flyers - Imagine that a single patient has many frequent hospitalizations and discharges from the selected facility with relationship to a single home health stay. Consider the image below:
- In example one, we have one discharge to one admission; if we think of this in a fraction, it is one divided by one, or, simply one. If that patient is hospitalized, we can say that, for the facility, we have one Discharge to Admission to Hospitalization event that would end up in the final metric.
- In example two, we have two discharges in the 30 day reference period. If we follow the same procedure, we can see that we now have two Discharge to Admission to Hospitalization events that will feed into the final % hospitalization metric.
- Smaller Denominator - In general, since the facility specific metric has a smaller population over all (see Venn Diagram, above) this makes the denominator of the equation smaller, which will increase the relative impact of the frequent flyers on the overall metric.


