
Overview
The Physician Groups Explore page displays metrics for medical groups — physician practices and organizations identified by a shared National Provider Identifier (NPI) — that are potential patient sources for home health in the states your company has contracted to see. Where the Physicians Explore page shows you individual providers one NPI at a time, the Physician Groups Explore page surfaces the organizational layer above: the practice or medical group that may employ or affiliate with many individual physicians under one identity.
 Understanding physician groups alongside individual physicians gives your sales team two lenses on the same market. A group relationship can open doors to multiple physicians at once — and it survives the individual transitions that single-NPI relationships often don't.
 For an overview of the features and tools shared across all Explore pages, see The Explore page. For information on the filters for the Physician Groups Explore page, see HHA - Physician Groups Explore page Filters.
 Let's get Oriented
You're on the Physician Groups Explore page — to get here, open the Explore page and click Physician Groups in the tab bar at the top (it sits alongside Physicians, Facilities, and the other provider types). The table lists medical groups in your contracted states. Click any group's name in the table to open the Analyze page for that physician group.

 Click on the image above to enlarge it.
In this Article
- Understanding the Metrics — definitions for every column in the table
- Physicians Preview Panel - A dropdown that shows a list of physicians for the physician group in the row
- Putting the Data to Work — how to use physician group data to build and prioritize your pipeline
Understanding the Metrics
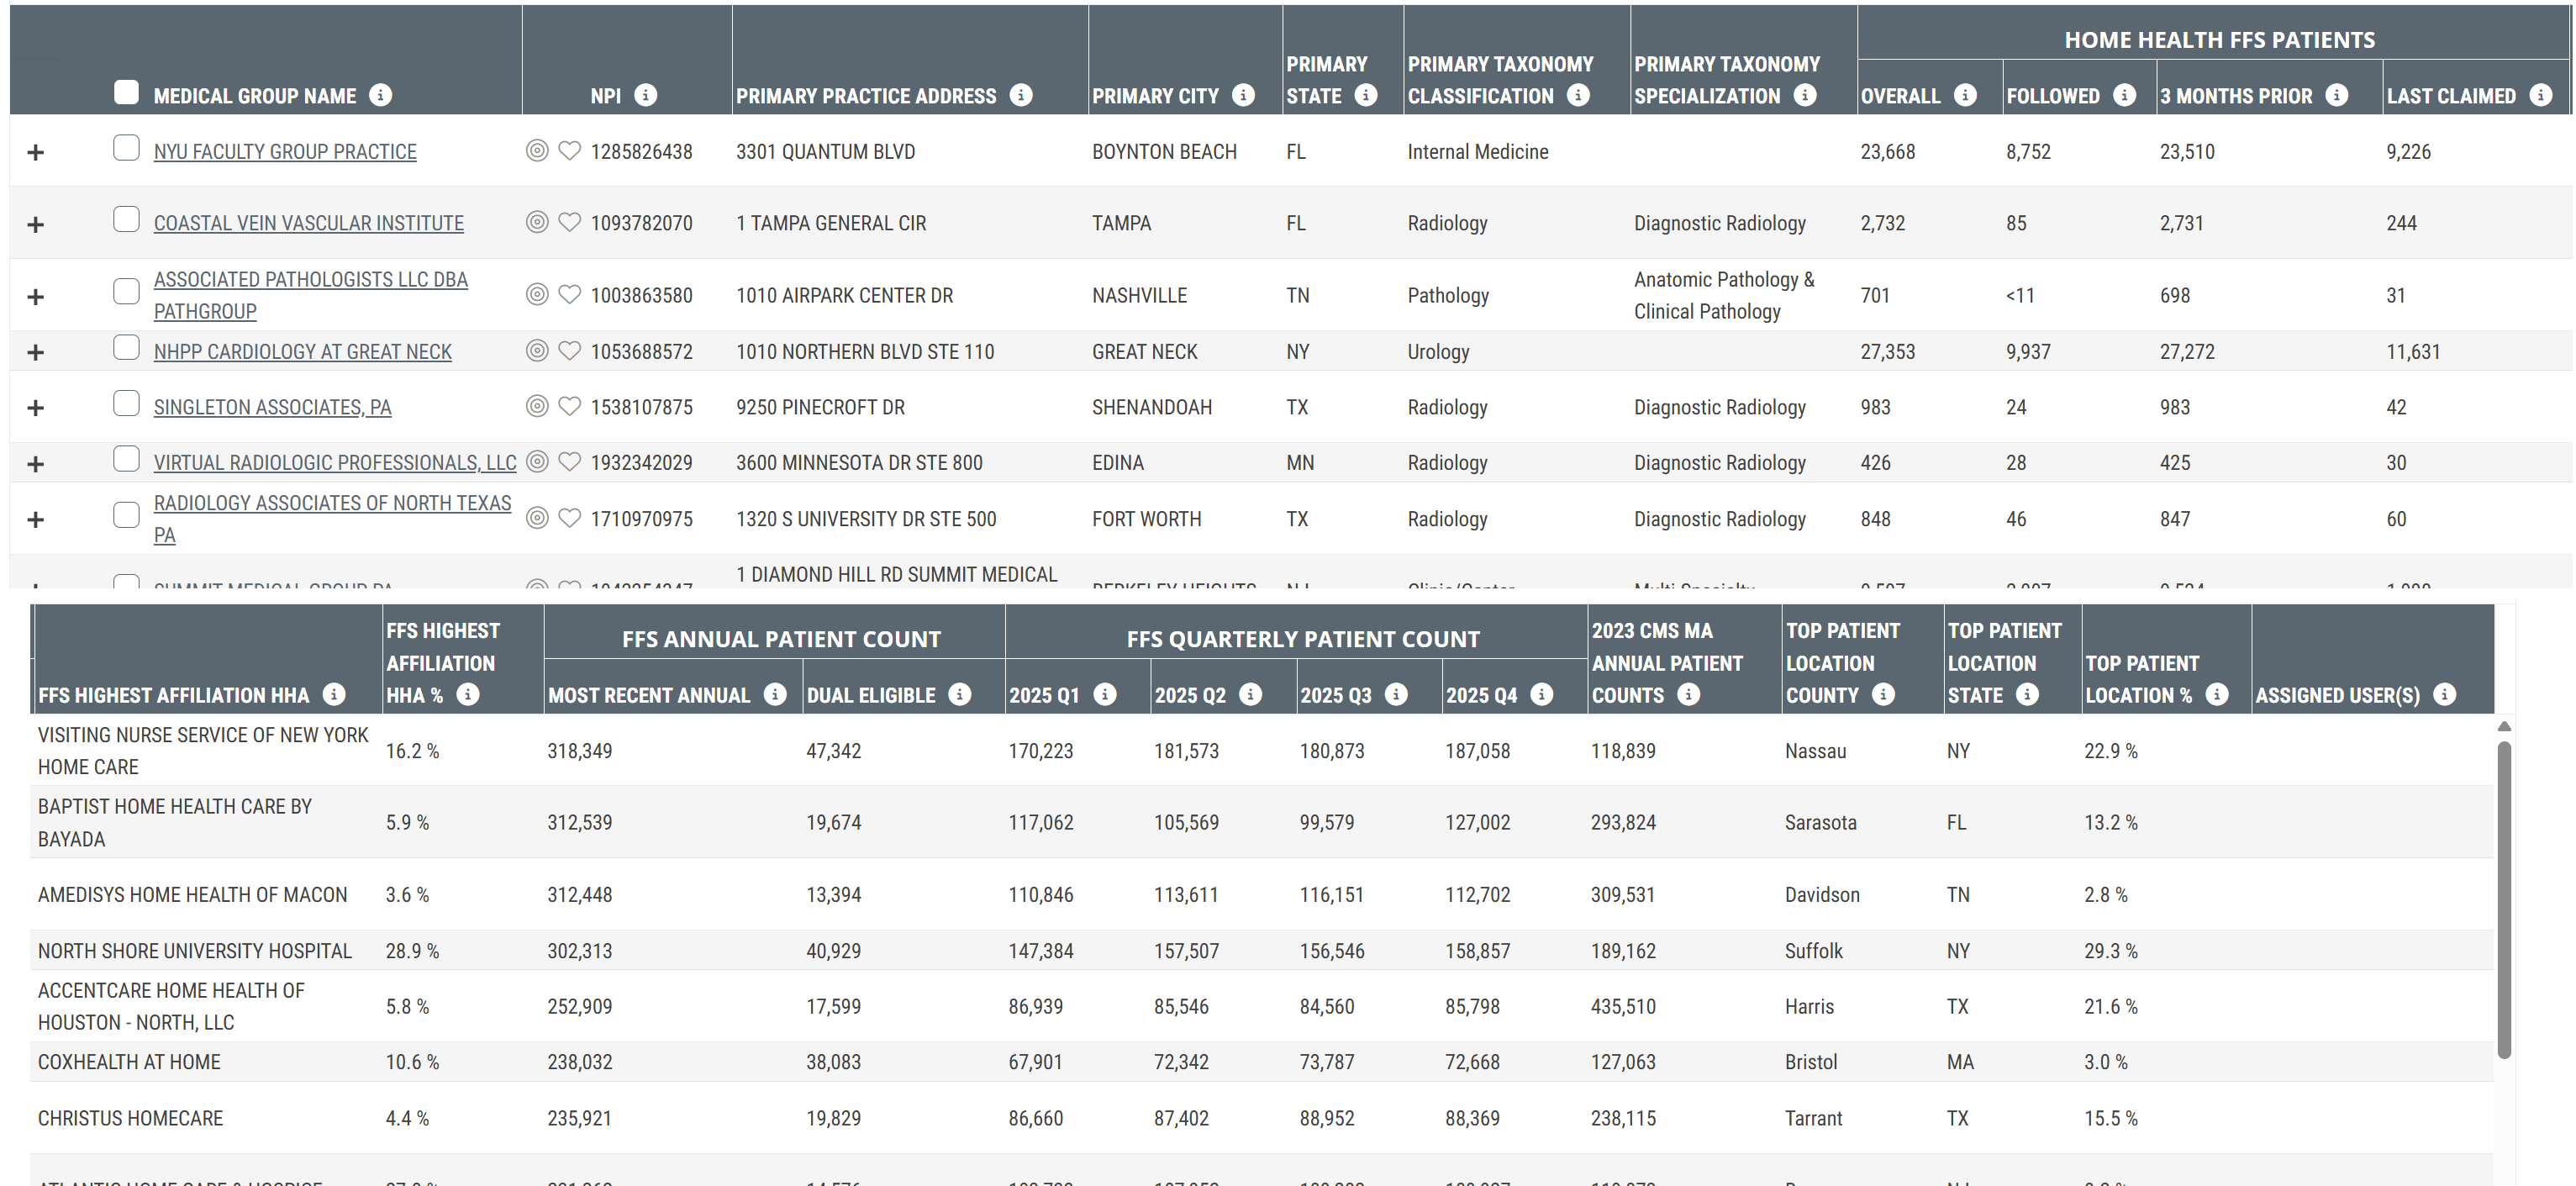
The following image shows the column headers from the Physician Groups Explore table. Because the table is wide, the headers have been sliced and stacked to make them easier to read. Click the image to enlarge it.
Metric |
Description |
|
| + - plus sign at far left | Clicking the "+" sign to the left of a physician group's name will open the Physicians Preview panel. See Physician Preview Panel, below. | |
|
Favorites/Targets
|
Click on these icons to make the listed organization a Favorite (heart icon) or a Target (target icon). | |
| Medical Group Name | The name of the physician group as listed in the NPI registry. Click the group name to open the Physician Group Analyze page for that group. | |
| NPI |
The National Provider Identifier for the listed physician group.
|
|
| Primary Practice Address |
The street address for the listed physician group's primary practice location, as registered in the NPPES NPI registry.
|
|
| Primary City | The city of the listed physician group's primary practice location. | |
| Primary County (not shown in image) | The county of the listed physician group's primary practice location. | |
| Primary ZIP Code (not shown in image) | The ZIP code of the listed physician group's primary practice location. | |
| Primary State | The state of the listed physician group's primary practice location. | |
| Primary Taxonomy Classification | The broad specialty classification for the listed physician group as registered in NPPES (for example: Radiology, Internal Medicine, Multi-Specialty). | |
| Primary Taxonomy Specialization | The more specific specialty within the primary taxonomy classification (for example: Diagnostic Radiology, Anatomic Pathology & Clinical Pathology). | |
| Home Health FFS Patients | Overall | The count of distinct Medicare FFS home health patients who were treated by physicians in the listed physician group during the one-year reporting period, across all claim relationship types, (Attended, 3 Months Prior, or Last Claimed). |
| Followed | The count of distinct Medicare FFS home health patients who were treated by physicians in the listed physician group who billed a Medicare claim as the following physician during the patient's home health episode. | |
| 3 Months Prior | The count of distinct Medicare FFS home health patients who were treated by physicians in the listed physician group who billed a Medicare claim in the three months prior to the patient's home health admission. | |
| Last Claimed | The count of distinct Medicare FFS home health patients who were treated by physicians in the listed physician group who filed the last Medicare claim before the patient's home health admission. | |
| FFS Highest Affiliation HHA | The name of the home health agency that received the highest share of the listed physician group's home health patients during the reporting period. | |
| FFS Highest Affiliation HHA % | The percentage of the listed physician group's home health patients who were served by the highest-affiliated home health agency. A high percentage indicates the group sends most of its home health referrals to a single agency. | |
| FFS Annual Patient Count | Most Recent Annual | The count of distinct Medicare FFS patients who received care from clinicians in the listed physician group during the specified time period, identified either through claims billed under the group’s NPI or through attribution linking the treating physician to the physician group. |
| Dual Eligible | The count of patients in the listed physician group's annual FFS patient population who are also enrolled in Medicaid (dual-eligible beneficiaries). | |
| FFS Quarterly Patient Count — 20YY Q# |
The count of distinct Medicare FFS patients who received care from clinicians in the listed physician group during the specified quarter, identified either through claims billed under the group’s NPI or through attribution linking the treating physician to the physician group.
|
|
| 20XX CMS Annual Patient Counts |
The count of Medicare Advantage patients associated with this physician group, as reported in the CMS MA data for the year shown in the column header.
|
|
| Top Patient Location County | The county of residence for the largest share of the listed physician group's home health FFS patients during the one-year reporting period, based on the beneficiary's county as filed on the claim. | |
| Top Patient Location State | The state of residence for the largest share of the listed physician group's home health FFS patients during the one-year reporting period. | |
| Top Patient Location % | The percentage of Medicare FFS patients treated by clinicians in the listed physician group during the one-year reporting period who reside in the top county and state. This value reflects the share of the physician group’s total Medicare FFS patient population represented by that top location, based on beneficiary residence information reported on claims. | |
| Assigned User(s) | The user(s) from your company currently assigned to this physician group. | |
 - not selected
 - selected
 Provider address information in Trella reflects the NPPES registry and is updated on a quarterly schedule. Address discrepancies may exist between quarterly updates.
 |
Physician Preview Panel
When you click on the "+" plus sign to the left of any physician group's name, the physician preview panel opens that displays a list of all physicians associated with the selected physician group.

Understanding the Metrics
Metric Name |
Description |
| Name/NPI | The physician's name and NPI, as listed in the CMS NPI Registry. |
| Home Health Patients (Overall) | The count of distinct Medicare FFS patients treated by the physician regardless of the physician group who received home health services (Followed, 3 Months Prior, and Last Claimed patients) during the one-year reporting period. |
| Taxonomy Specialty |
Physician's self-reported primary specialty; from the CMS NPI Registry. |
| Taxonomy Sub-specialty | Physician's self-reported primary sub-specialty; from the CMS NPI Registry. |
| State/City/County/ZIP Code | The state, city, county, and ZIP code for the listed physician's primary practice address; from the CMS NPI Registry. |
|
Putting the Data to Work
Find your highest-volume groups first. Sort by Home Health FFS Patients — Overall to rank physician groups in your market by home health patient volume. The groups at the top are already generating the referral activity — your goal is to understand where those patients are going and position your agency in that conversation.
Understand concentration before you compete. Check the FFS Highest Affiliation HHA and FFS Highest Affiliation HHA % columns together. A group with a very high affiliation percentage sends most of its home health referrals to a single agency — that's a concentrated relationship worth knowing about. A group with a low affiliation percentage is splitting referrals across multiple agencies and is more open to a new one.
Use location data to qualify your pipeline. The Primary Practice Address and Top Patient Location columns together tell you where a group practices and where their patients actually live. A group whose patients cluster in your service territory is a real opportunity; one whose patients are concentrated outside your area may not be worth the focus.
Connect group volume to individual outreach. The Physician Groups Explore page tells you which practices to prioritize. Click a group name to open the Physician Group Analyze page — where you'll find the individual physicians in that group, their referral destinations, and patient population data. Use the group to set your priority; use the Analyze page to plan your approach.
Track your growing relationships. Use Favorites to flag groups you are actively working. Use Targets to flag groups you are pursuing. Both tools let you filter the table to your active pipeline so you can track progress at a glance.
|