Overview
Every Analyze page provides a simple way to produce a default presentation containing the most insightful charts for the selected provider.
In this article we will examine where the content of the default presentation can be found in Trella Insights, then we will summarize the content of each section of the default presentation.
![]() To create the default presentation, click
To create the default presentation, click ![]() at the top right of the Analyze page.
at the top right of the Analyze page.
![]() Once the default presentation has been created, you can save it and customize it, adding other charts that you have saved to your chart cart.
Once the default presentation has been created, you can save it and customize it, adding other charts that you have saved to your chart cart.
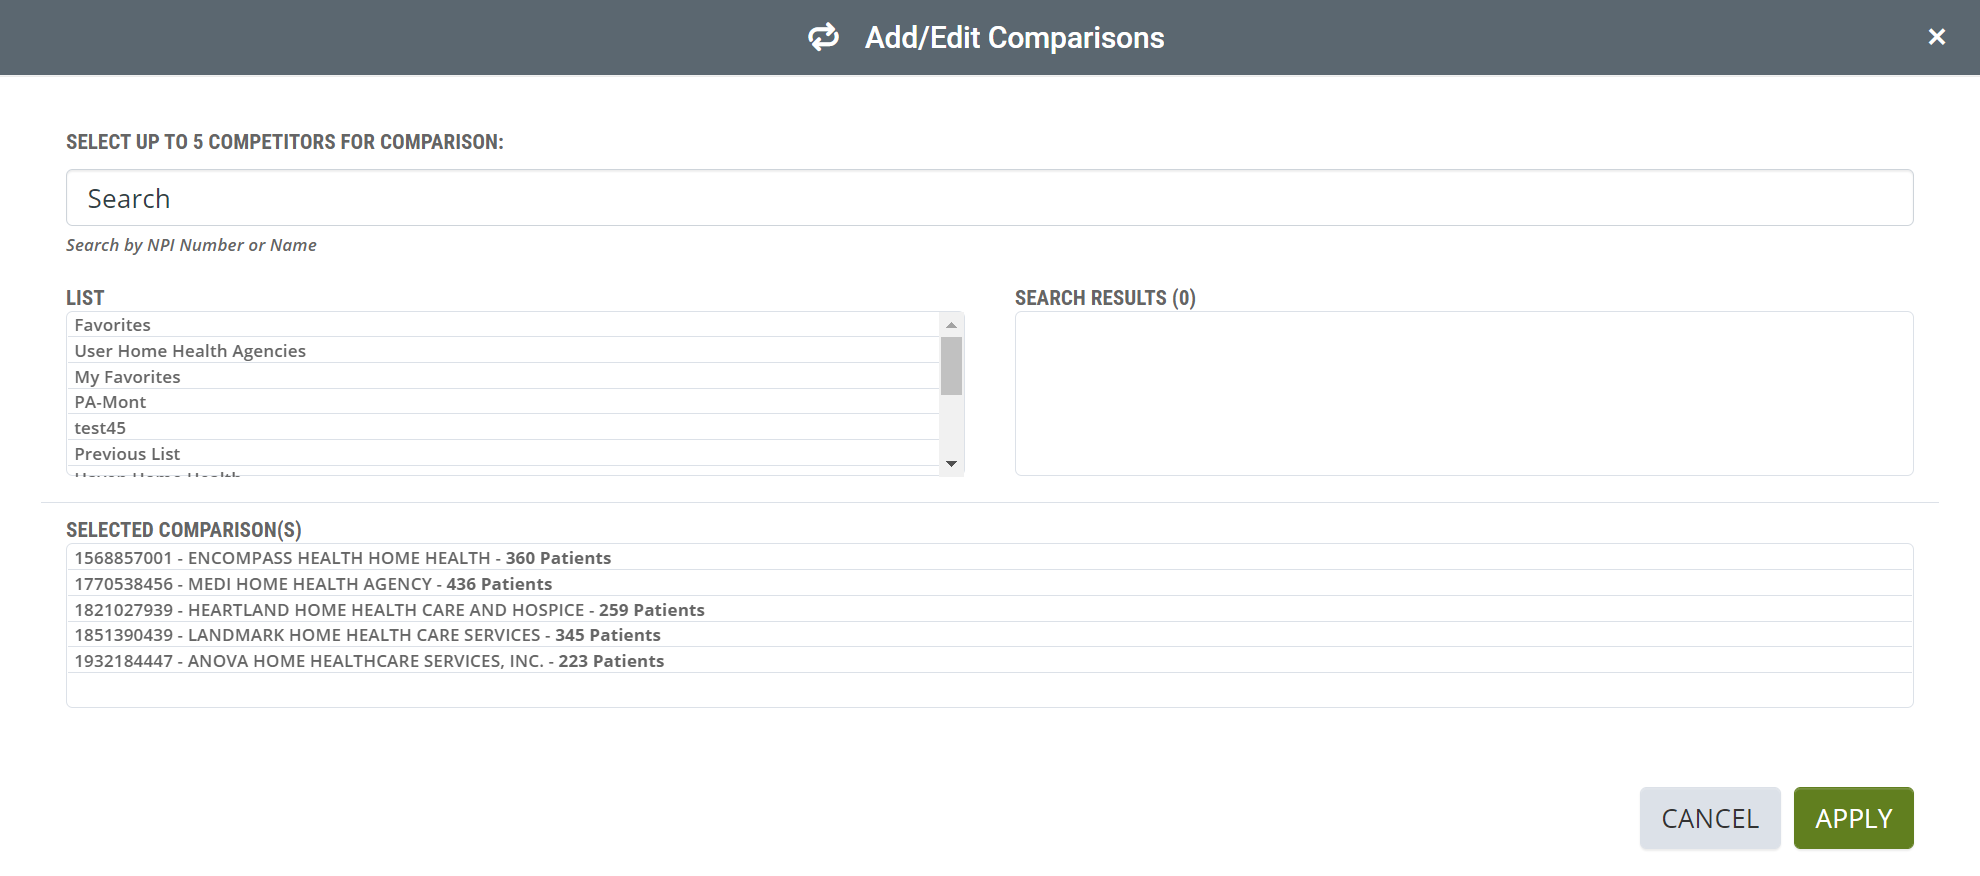
![]() In this article we need to differentiate between the initial provider, that is, the provider on the Analyze page where we clicked on Presentation, and the post-acute agencies chosen for comparison in the presentation. We call the initial provider - selected, and the agencies - chosen. (The "chosen" post-acute agencies were added to the report using the Add/Edit interface as shown in the image below.
In this article we need to differentiate between the initial provider, that is, the provider on the Analyze page where we clicked on Presentation, and the post-acute agencies chosen for comparison in the presentation. We call the initial provider - selected, and the agencies - chosen. (The "chosen" post-acute agencies were added to the report using the Add/Edit interface as shown in the image below.
Where do the Charts come from?
The table below has an image of a default presentation on the left and an overlay image on the right that indicates where each table/chart can be found in Trella Insights.
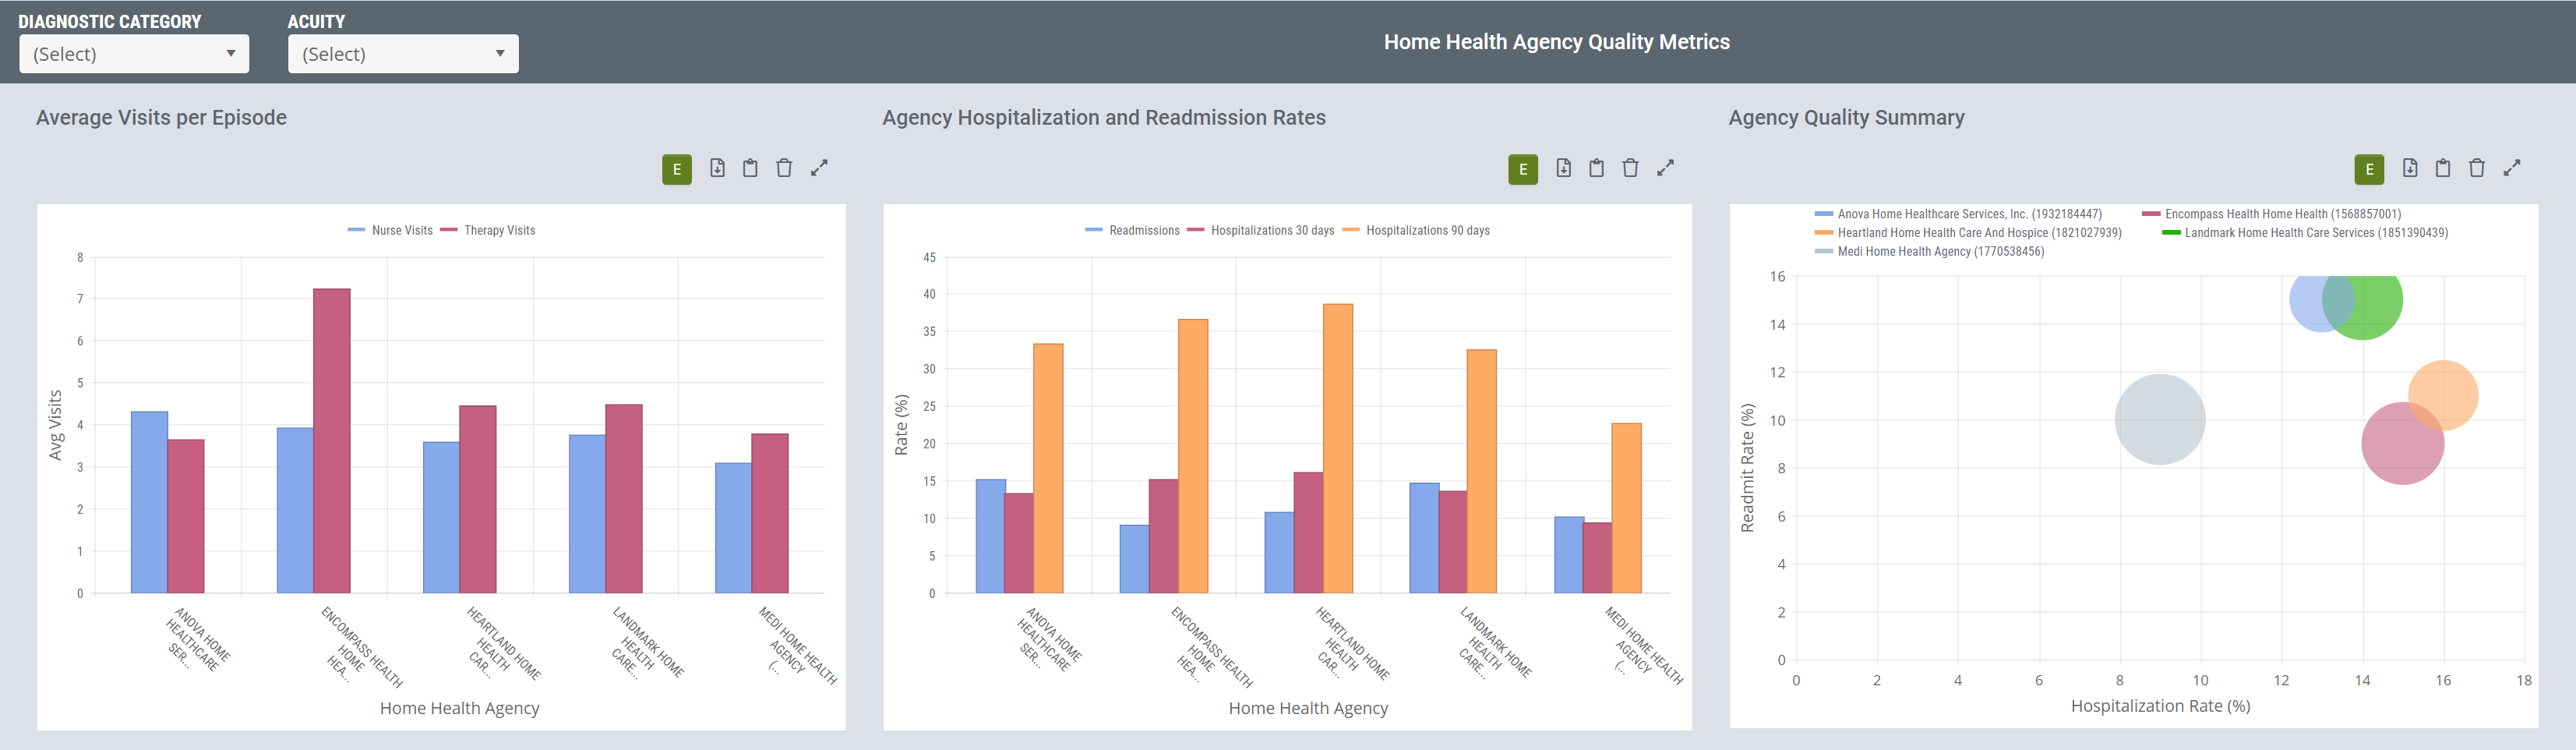
Home Health Quality Metrics
![]() In this example, we hovered over the chart images for Heartland Home Health Care and Hospice to reveal the in chart metrics for comparison.
In this example, we hovered over the chart images for Heartland Home Health Care and Hospice to reveal the in chart metrics for comparison.
![]() This section of three charts are identical to the three bottom charts in the Default Presentation for Physicians if you choose the same home health agencies for comparison.
This section of three charts are identical to the three bottom charts in the Default Presentation for Physicians if you choose the same home health agencies for comparison.
 |
||
|
Average Visits per Episode
Nurse Visits and Therapy Visits - These metrics are the average number of visits provided by each specialty per 30 day episode for billing periods completed during the one-year reporting period. In short, the average number of nursing and therapy visits per episode for the chosen home health agency. Where to find these metrics HHA Explore Page These metrics can be found on the explore page for all home health agencies.
Analyze page for the chosen home health agency Under the Operational tab the Average Visits table shows these two metric for the chosen home health agency.
|
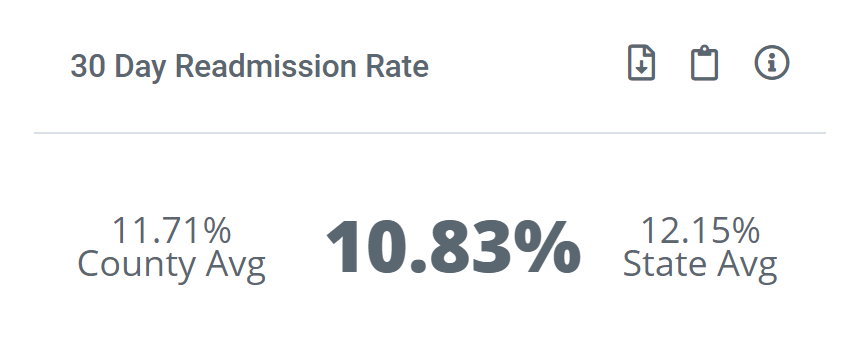
Agency Hospitalization and Readmission Rates
Readmissions This metric can be found two places: 1) Explore page for the chosen home health agency
2) Analyze page for the chosen home health agency in the Insights tab
Hospitalization Rate: SOC to 30 Days This metric can be found three places: 1) On the Explore page for the chosen home health agency
2) On the Analyze Page for the chosen home health agency in the Insights tab.
3) On the Analyze page for the chosen home health agency in the Quality tab in the Hospitalization Rates within 30 Days from Start of Care by Acuity table.
Hospitalization Rate: SOC to 90 Days Analyze Page Insights This metric can be found in one other location in Trella Insights. This metric can be found on the Analyze page for the chosen home health agency in the Quality tab in the Hospitalization Rates within 90 Days from Start of Care by Acuity table.
|
Agency Quality Summary
- Hospitalization Rate: SOC to 30 Days This metric can be found three places: 1) On the Explore page for the chosen home health agency
2) On the Analyze Page for the chosen home health agency in the Insights tab.
3) On the Analyze page for the chosen home health agency in the Quality tab in the Hospitalization Rates within 30 Days from Start of Care by Acuity table.
Readmissions This metric can be found two places: 1) Explore page for the chosen home health agency
2) Analyze page for the chosen home health agency in the Insights tab
Volume - this metric is called Annual Patient Count (FFS) in other locations This metric is the count of distinct patients admitted to the listed home health agency. 1) HHA Explore Page Annual Patient Count (FFS) can be found on the HHA Explore page for every listed home health agency
2) HHA Analyze > Pat Pop - Pat Vol This metric is also found on the Analyze page for any home health agency in the Patient Population tab in the Patient Volume table.
|