Overview
The Home Health Agencies Explore page includes one table that displays metrics for all home health agencies in the states your company has contracted to see. Through the use of filters, or by browsing and choosing favorites, you can display a selection of agencies in the table of interest to you.
![]() On the Physicians Explore page and the Facilities Explore page, the primary use case is to target specific providers for attention as potential referral sources. The Home Health Agencies Explore page is useful for comparing your agency with other home health agencies to evaluate your competitive position. If you are developing new business and want to look for a potential merger or acquisition, this table will help you to evaluate facilities with potential.
On the Physicians Explore page and the Facilities Explore page, the primary use case is to target specific providers for attention as potential referral sources. The Home Health Agencies Explore page is useful for comparing your agency with other home health agencies to evaluate your competitive position. If you are developing new business and want to look for a potential merger or acquisition, this table will help you to evaluate facilities with potential.
![]() For an overview of the features and tools on the Explore page, see The Explore page.
For an overview of the features and tools on the Explore page, see The Explore page.
 In this article
- Understanding the Metrics - definitions for the metrics in the table
- Usage - some tips on using the Home Health Agencies Explore page
Understanding the Metrics
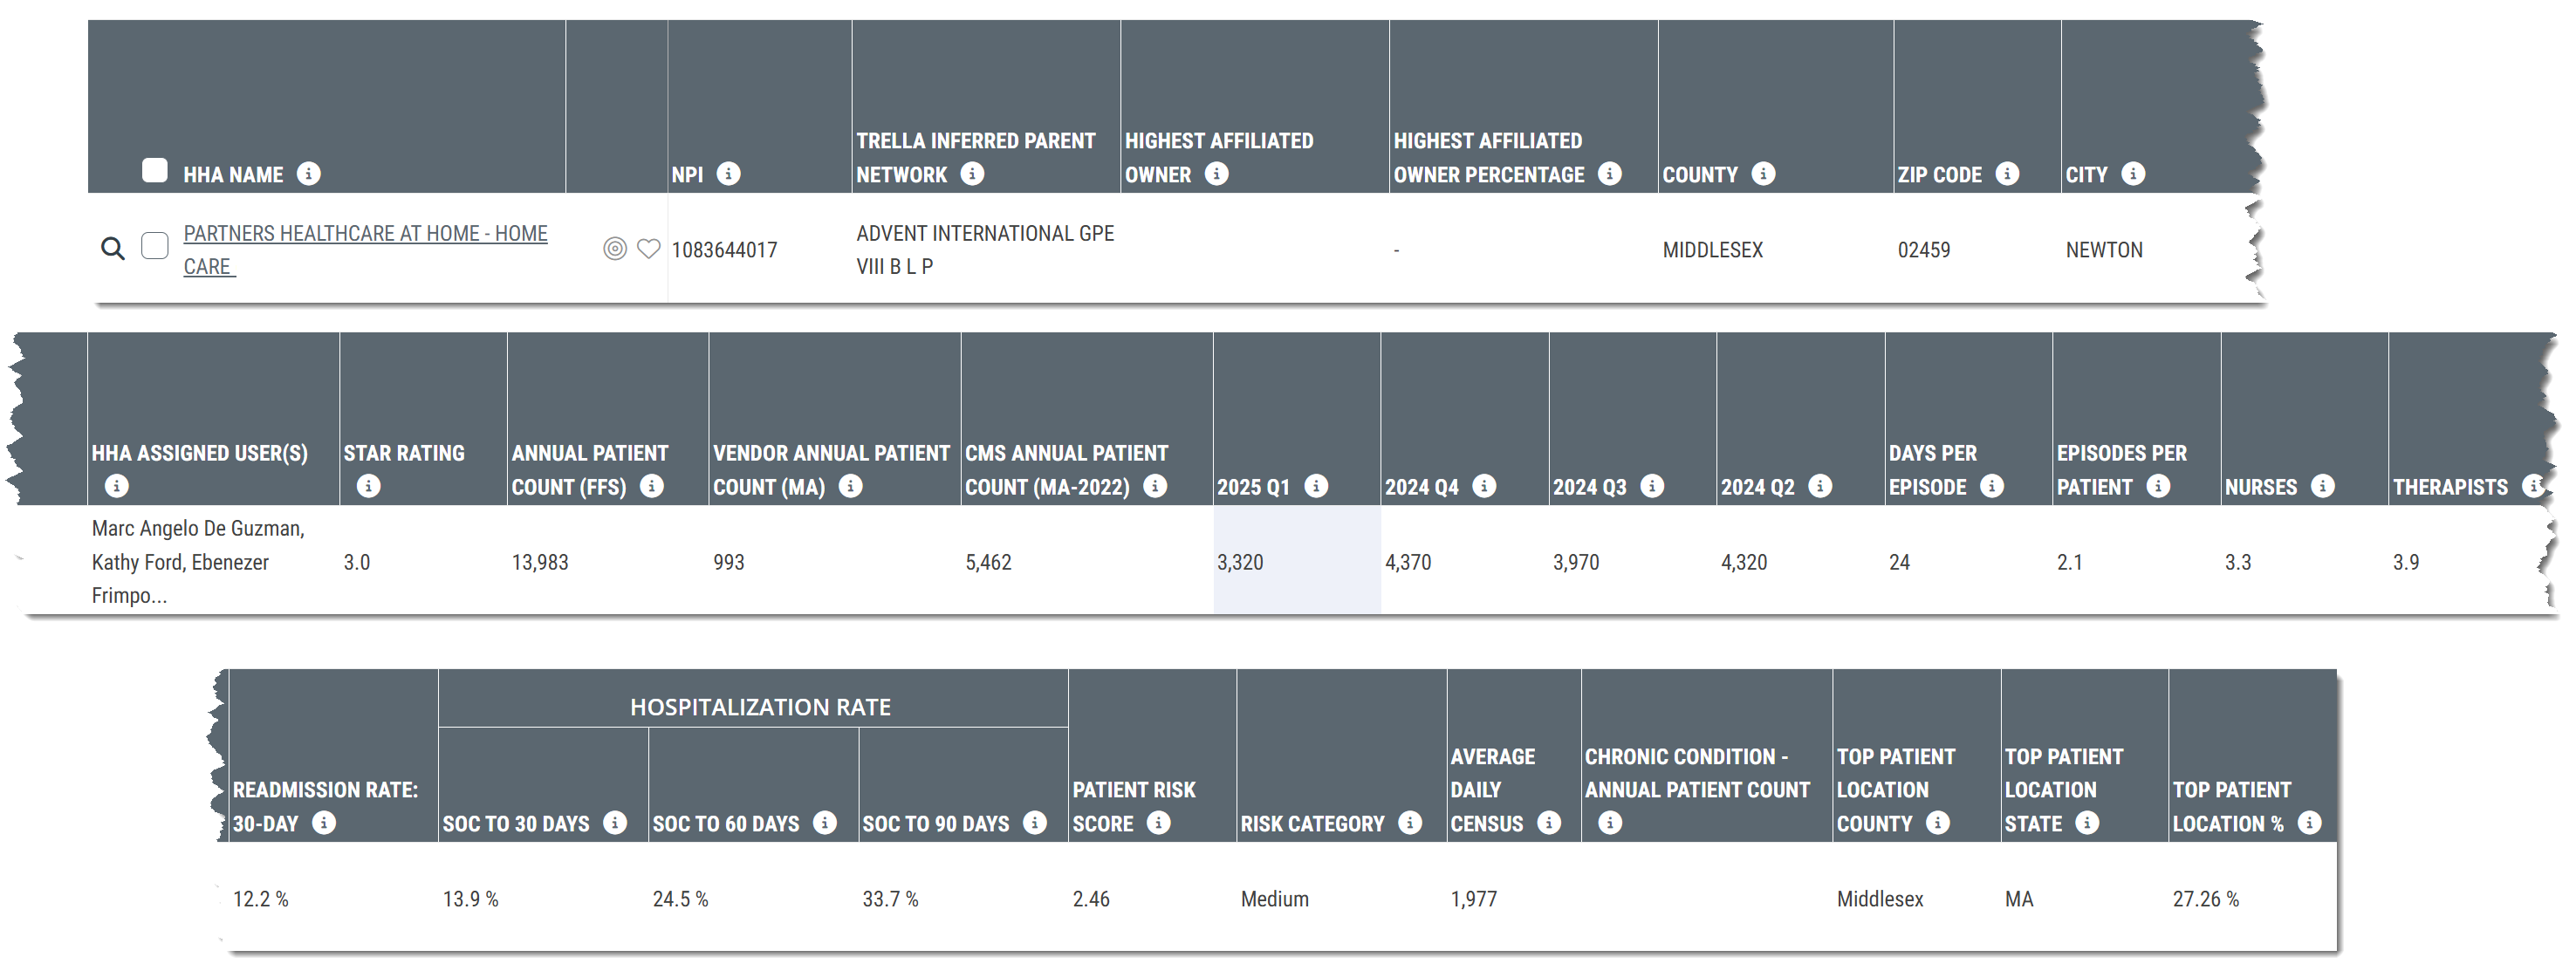
The following image shows the headers from the top of the Home Health Agencies Explore table. To make the image a bit easier to see, we have sliced up the full spread of headers and stacked them. To make the image larger click on it.
The definitions are listed below the image.
Column name |
Description |
|
| HHA Name/NPI | The name of the home health agency and the NPI as listed in the NPI Registry | |
| State/County/Street Address/City/ZIP Code | Address information for the listed home health agency. | |
| Trella Inferred Patient Network | A corporate parent entity for a collection of NPI's that has been identified by Trella as an owner, operator, or manager of multiple healthcare providers, using CMS Ownership data in addition to other data sources. | |
| Highest Affiliated Owner | The name of the highest affiliated direct owner of the listed agency. JV indicates Joint Venture. NP indicates Not for Profit. Additional owner details can be found on the Analyze page. | |
| Highest Affiliated Owner Percentage | The percentage ownership of the highest affiliated direct owner of the agency. Additional owner details can be found on the Analyze page. | |
| HHA Assigned User(s) | The user(s) from your company assigned to the listed home health agency | |
| Star Rating | Rating from the CMS five-star quality rating system to measure the experiences Medicare beneficiaries have with their health plan and health care system on a scale of 1 to 5 stars, with 5 being the highest quality. | |
| Annual Patient Count (FFS) | The count of distinct patients admitted to the listed home health agency during the one-year reporting period. | |
| Vendor Annual Patient Count (MA) |
Count of distinct Medicare Advantage patients treated by the listed HHA during the one-year reporting period ending in the quarter and years listed at the top of every page in Trella Insights. (See image.)
|
|
| Annual Patient Count (MA-20YY) | The count of distinct Medicare Advantage patients admitted to the listed home health agency as counted from the most recent MA data available from CMS. | |
| Annual Patient Count (MA/Commercial 65+) | This metric is the count of distinct MA/Commercial (Age 65+) patients admitted to the listed home health agency during the one-year reporting period. | |
| 20YY-Q# | Count of distinct patients (FFS) admitted to the listed home health agency during the year and quarter identified in the header. | |
| Days per Episode | The average number of days per 30-day billing period completed at the listed agency during the one-year reporting period. | |
| Episodes per patient | The average number of 30-day billing periods per patient stay completed at the listed agency during the one-year reporting period. | |
| Nurses | The average number of nurse visits per 30-day billing period completed at the listed agency during the one-year reporting period. | |
| Therapists | The average number of therapist visits per 30-day billing period completed at the listed agency during the one-year reporting period. | |
|
Readmission Rate: 30-Day |
The rate at which the listed HHA's patients came from an inpatient setting, were newly admitted to the listed home health, and were subsequently readmitted to any hospital within 30 days of the first inpatient discharge; includes transfers (based on two years of discharges, shifted back 30 days) | |
|
Hospitalization Rate |
SOC to 30 Days | Overall two-year hospitalization rate for patients who were admitted to the listed home health agency and hospitalized within 30 days from start of care at the home health agency. |
| SOC to 60 Days | Overall two-year hospitalization rate for patients who were admitted to the listed home health agency and hospitalized within 60 days from start of care at the home health agency. | |
| SOC to 90 Days | Overall two-year hospitalization rate for patients who were admitted to the listed home health agency and hospitalized within 90 days from start of care at the home health agency. | |
| Patient Risk Score |
Average Hierarchical Condition Category (HCC) Patient Risk Score for the given NPI
|
|
| Risk Category |
Trella Health has created these categories to make a general comparison between agencies quick and easy.
|
|
| Average Daily Census | Represents the average number of patients the listed agency serves daily; calculated as the sum of patient days during the one-year reporting period, divided by 365 | |
| Chronic Condition - Annual Patient Count |
The count of distinct patients treated during the one-year reporting period who met the criteria for the selected chronic condition based on the CCW Chronic Condition algorithm.
|
|
| Dual Eligible Patients | The count of distinct Medicare FFS patients who were admitted to the home health agency and were eligible for Medicaid coverage during the one-year reporting period | |
| Top Patient Location - County | The top county of residence for Medicare FFS patients who were treated by the listed home health agency during the one-year reporting period; based on the beneficiary's county filed on the claim. | |
| Top Patient Location - State | The top state of residence for Medicare FFS patients who were treated by the listed home health agency during the one-year reporting period; based on the beneficiary's county filed on the claim. | |
| Top Patient Location % | The percentage of Medicare FFS patients treated by the home health agency during the one-year reporting period associated with the top patient state and county. | |

 Usage
Usage
The Home Health Agencies Explore page allows you to display home health agencies of interest to you. By creating a custom list of facilities, it is easy to always show those that are most important for your planning and strategy.
 Evaluate
The numerous metrics available in the table allow you to do a deep evaluation of your own home health agencies, a competitor, or any other agency of interest. The spread of patient counts provide a helpful view of the size of the historical patient population. A variety of performance metrics allow you to confirm that your facility is keeping pace with your goals for clinical excellence.
![]() Analyze page - Keep in mind that clicking on the name of an agency listed in the table will open the Analyze page for that home health agency, which includes even more detailed metrics for evaluation.
Analyze page - Keep in mind that clicking on the name of an agency listed in the table will open the Analyze page for that home health agency, which includes even more detailed metrics for evaluation.
 Compare
Using the same metrics in the Home Health Agencies Explore table, you can compare multiple agencies to see how your agency compares to the competition.
![]() Market Share Report - On the Reports page, you can perform a detailed evaluation of a selected market, comparing the market share of patients for all home health agencies in the market, including market share trends over two years.
Market Share Report - On the Reports page, you can perform a detailed evaluation of a selected market, comparing the market share of patients for all home health agencies in the market, including market share trends over two years.