Overview
The Market Share page provides a rock-solid foundation for understanding your home health agency's share of patients who reside in a selected state or county. (Or multiple counties in a single state.) The tables on this page will give you a view of the total patients admitted to home care and the breakdown of patients for home health agencies in the geographic region that you select.
![]() Page Summary - The Market Share page is where you will perform a competitive analysis for your agency or agencies. The goal is to find your market share in fixed territories and identify your primary competitors. You will then create a list of competitors that will be used throughout Trella Insights for Home Health.
Page Summary - The Market Share page is where you will perform a competitive analysis for your agency or agencies. The goal is to find your market share in fixed territories and identify your primary competitors. You will then create a list of competitors that will be used throughout Trella Insights for Home Health.
![]() For more information, check out the article: Perform a Competitive Analysis.
For more information, check out the article: Perform a Competitive Analysis.
 In this article
- Selecting a region - State or County/Counties
- Understanding the Metrics - five tables
- Understanding % Change Admits
- Market Share Change
- What if my region is on a state border?
Selecting a region
Report type Filter
|
|
 |
| The table names will change to reflect your choice. For example, the image above shows that "County" is selected for the Report Type. The metrics on the page will all be calculated from the county or counties that you subsequently choose, and the table names will show your choice as shown in the image below. | |
| State table title - If you choose the "State" report type, the table title will match. |  |
| County table title - If you choose the "County" report type, the table title will include the word "County." |  |
| All tables on the Market Share page will match your choice. | |
How to select a region
|
Your first step will be to choose whether you want to look at state or county metrics on this page. As a rule, starting with a single county (or a few counties) will align more closely with a sales territory. For that reason, we suggest starting with county metrics.
|
 |
![]() Although in this article we focus on metrics for a single county, the descriptions included herein will be parallel to the metrics if you choose to look at data for a state or for multiple counties.
Although in this article we focus on metrics for a single county, the descriptions included herein will be parallel to the metrics if you choose to look at data for a state or for multiple counties.
Understanding the Metrics
As we examine the tables from the Market Share page, we will use examples that reflect a single county. The columns and rows in the state and county tables are the same.
State or County Totals
The top table contains the counts of FFS and MA enrollees, mortalities, and home health admissions for the county or state you selected. There are 8 quarters of metrics that allow you to see long range trends of Enrollee counts. This table includes metrics related to both Medicare FFS and Medicare Advantage.

| Columns | |
| First Column - unnamed | The first column identifies the source and type of metrics in each row (See details below) |
| Recent Four Quarters |
This is a count of the patient type listed in the row for the most recent year (four quarters)
|
| Year Quarter - 20XX QY | This is a count of the patient type listed in the row for the quarter listed in the header |
| Rows | |
|
Medicare FFS Enrollees |
This row shows the counts of Medicare patients enrolled in Medicare FFS residing in the selected state or county/counties during the period listed in the column header. |
|
Medicare Advantage Enrollees |
This row shows the counts of patients enrolled in Medicare Advantage residing in the selected state or county/counties during the period listed in the column header. |
| Mortalities (FFS & MA) | The count of all Medicare FFS or Medicare Advantage patients who died during the period identified for the column. |
| Home Health Admissions Total (FFS only) | This row shows the counts of admissions to home health care during the period listed in the column. The counts in this row were compiled from only Medicare FFS claims. |
![]() Enrollees - These metrics are counts of patients enrolled in FFS or MA based on the Master Beneficiary Summary File, not from Medicare FFS or MA claims.
Enrollees - These metrics are counts of patients enrolled in FFS or MA based on the Master Beneficiary Summary File, not from Medicare FFS or MA claims.
![]() For more information, see ResDAC's article: Enrollment Source.
For more information, see ResDAC's article: Enrollment Source.
 Usage
Usage
-
Patient Population
- This table establishes a baseline for understanding the Market Share table below it.
- The counts of enrollees, mortalities, and admissions are the "pool" of patients who resided in your selected region.
- When you evaluate your home health agencies in the Market Share table below, you can see how the counts of admissions at your agency are used to created the market share percentages from the population totals.
-
Patient Population Trends
- In addition to the counts of enrollees, mortalities and admissions, you can also see how the counts of patients have trended over the past two years.
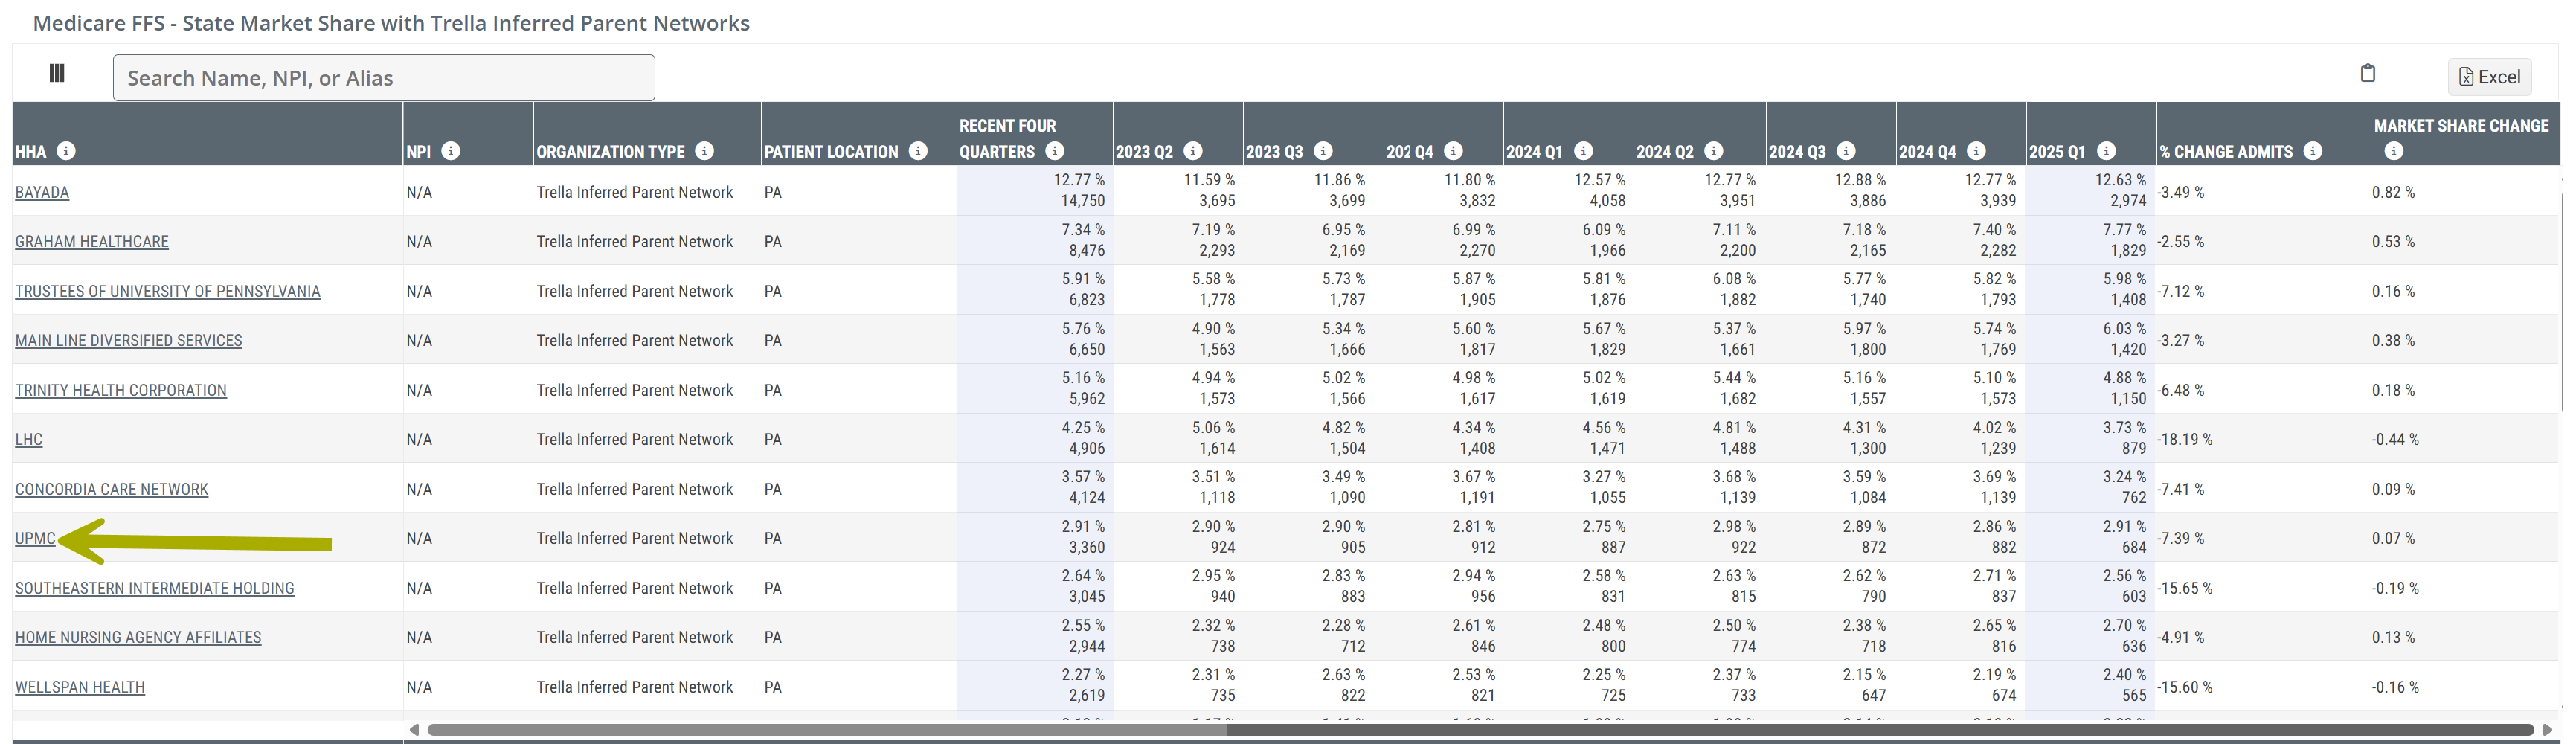
Medicare FFS - State or County Market Share with Trella Inferred Parent Networks
This table includes two types of entries:
- Trella Inferred Parent Networks
- Home health agencies that are not associated with a TIPN.
This table shows market share metrics for Trella inferred parent networks and any home health agencies that are not identified with a TIPN. The two metrics shown for each time period listed in the header are the market share percentage and the patient count. For example, if you look at the first row for the TIPN Bayada, the market share percentage for the selected state is 12.77% for patient counts in the most recent four quarters. The percentage is based on the patient count of 14,750 patients.
 Important details
- This table is similar to the table below it on the same page, Medicare FFS - County or State Market Share. There are some clever differences.
- Associated with a TIPN - if a home health agency is identified with a TIPN, the TIPN is shown in the table, but that home health agency is not shown. The counts for that agency are included in the counts for that TIPN.
- Not associated with a TIPN - any home health agency that is not associated with a TIPN is shown as itself in this table
- Since the table compares networks to agencies, you should expect that the networks will bubble to the top with the largest percentages of patients.
- Any TIPN listed will not have an NPI
- The blue columns indicate that the counts in those columns are smaller. For details, see Why is the Latest Quarter of Home Health Metrics Lower and Highlighted?
![]() For more information about TIPN, see Trella Inferred Parent Network (TIPN) in Trella Insights.
For more information about TIPN, see Trella Inferred Parent Network (TIPN) in Trella Insights.
Understanding the Metrics
Column/metric name |
Details |
| HHA | The name of the home health agency or the Trella Inferred Parent Network shown in each row. |
| NPI | The NPI of the home health agency listed - only for rows that contain home health agencies. Rows that include a TIPN will say "N/A." |
| Organization Type |
"This column categorizes entities based on their organizational structure, differentiating between aggregated entities and individual entities." More simply, this will either say "Trella Inferred Parent Network" or "Home Health Agency." |
| Patient Location | The state or county or counties that you chose in the location settings. |
|
Recent Four Quarters and Quarterly columns - 20XX QY The annual metrics and the quarterly metrics are calculated the same way.
Top/Bottom - Each Cell includes two metrics
|
Two metrics Top - This is the percentage of all patients who resided in the listed state/county who were admitted to the home health agency or Trella inferred parent network named in the row during the year or quarter in the header. In short, this is the market share of home health patients admitted to the HHA/TIPN in the row. Bottom - This is the count of the patients who resided in the selected county who were admitted to the home health agency or Trella inferred parent network listed in the row during the year or quarter identified in the header.
|
| % Change Admits | This is the percent of growth or loss of patient census for the home health agency in the row. For calculation details, see below. |
| Market Share Change |
This metric is the change in market share between the most recent four quarters compared to the previous four quarters. For more information, see below. |

TIPN Analyze page
The name of every TIPN is a link to the Analyze page for that TIPN. The arrow in the image is included as a reminder that clicking on the name will open the TIPN Analyze page for the selected TIPN.
![]() For more information about the TIPN Analyze page, see HHA TIPN Analyze page.
For more information about the TIPN Analyze page, see HHA TIPN Analyze page.
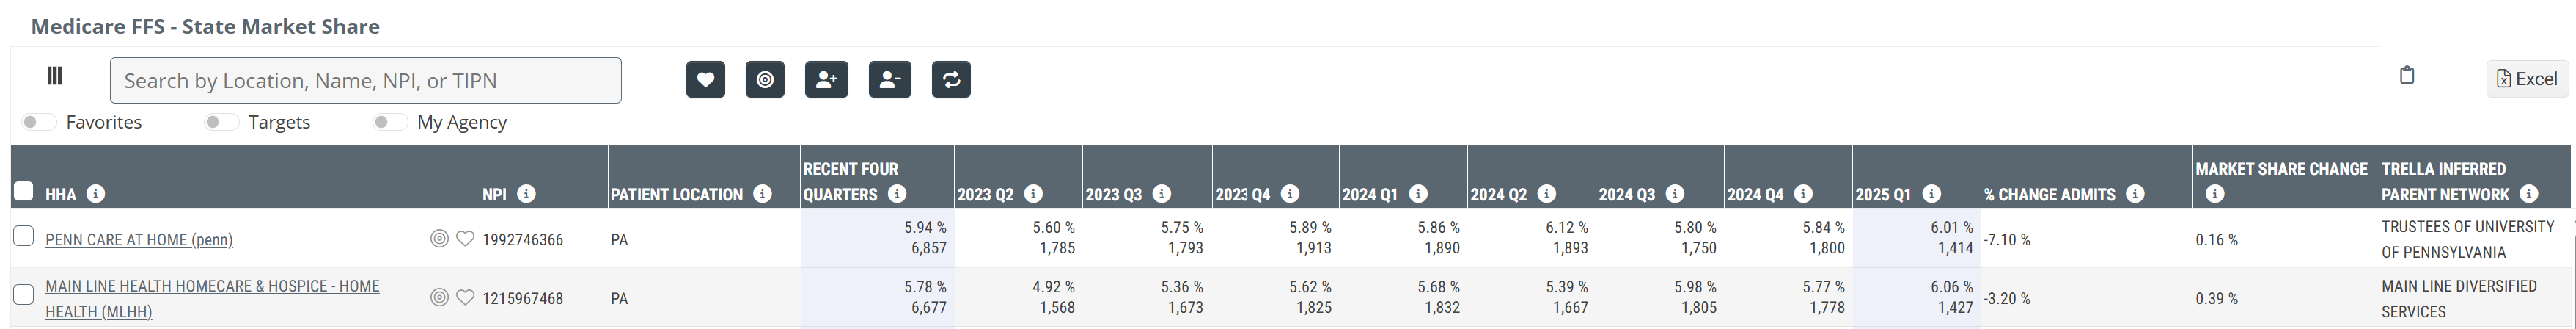
Medicare FFS - State or County Market Share
This table contains the home health agencies that admitted Medicare FFS patients who resided in the county, counties, or state that you selected using the Report Type settings.
![]() Click on the image to enlarge it.
Click on the image to enlarge it.
| Column | Description |
| Home Health Agency/NPI | This is the name of the home health agency and NPI as listed in the CMS Provider Data (NPI) file. |
| Patient Location | This is the county and/or state from which the metrics in the row are calculated. Therefore, the location represents the residence of the patient, not the agency location. |
|
Recent Four Quarters and Quarterly columns - 20XX QY The annual metrics and the quarterly metrics are calculated the same way.
Top/Bottom - Each Cell includes two metrics
|
Two metrics Top - This is the percentage of patients who resided in the listed patient location who were admitted to the agency listed in the row during the year or quarter named in the header. In short, this is the market share of home health patients admitted to the agency listed in the row. Bottom - This is the count of patient admissions who resided in the listed patient location who were admitted to the home health agency named in the row during the year or quarter listed in the header.
|
| % Change Admits | This is the percent of growth or loss of patient census for the agency listed in the row. For calculation details, see below. |
| Market Share Change |
This metric is the change in market share between the most recent four quarters compared to the previous four quarters. For calculation details, see below. |
| Trella Inferred Parent Network | A corporate parent entity for a collection of NPI's that has been identified by Trella as an owner, operator, or manager of multiple healthcare providers, using CMS Ownership data in addition to other data sources. |
 Metrics Calculation
Admissions - (bottom metric)

This is a count of home health admissions to the home health agency listed in the row taken from the institutional claims for patients who resided in the selected location during the period identified in the column header.
Market Share - (Top Metric)
The percentage of admissions who were admitted to the home health agency listed in the row. This percentage is calculated using the following formula.
![]()
If we look at the image below, we can see the numerator and the denominator

Numerator - The count of admissions to the listed home health agency. From the image, we can see that there were 1,384 admissions to Wellspan VNA Home Care during the most recent four quarters.
Denominator - The count of all home health admissions in the selected region during the most recent four quarters. From the top table, we can see that the admissions count is 3,377.
Filling in the equation, we can see how the Market Share (top metric) is calculated.

 Market Share table - Details
-
% Change Admits and Market Share Change - These two metrics are at the far right in the Market Share table.
- The % Change in Admits and Market Share Change columns will not display data when multiple counties are selected.
- If the counts for the agency in the row are <11s, the % Change in Admits and Market Share Change columns will not show any metrics. In these situations, the lack of counts makes any calculation impossible.

- * at the end of the name - In order to comply with CMS suppression rules, NPI/patient location rows with <11 admissions display an estimated percentage based on an equal distribution of admission counts within the user selected counties (i.e. Names ending with * represent estimated values).

- If the counts for an agency in any column is <11, no market share will be calculated for that period. Instead, the table will show ins.
- In order to provide a more accurate comparison to the most recent quarter of data which is incomplete, the previous four quarters used in the % change market share calculations are limited to claims having a "through" date within the specified time period.
- Keep in mind that the home health agencies shown in the table include any agency that treated a patient who resided in the selected region. Some, if not many, of the agencies will therefore not be found in the same region.
Usage
In general, there are three uses of the Market Share tables:
 Evaluate the Market Share metrics for your agency
- What is your current market share of Medicare FFS? Medicare Advantage?
- Is your market share and patient census trending up or down?
- Compare your Medicare FFS market share to your Market Advantage market share
- How does your performance in the market align with your overall strategy?
Evaluate the Market Share metrics for your competitors
- Identify other agencies with significant market share percentages and patient (admission) counts
- Look for market share trends over time
- Compare market share metrics and trends over time for Medicare FFS and Medicare Advantage - do any trends identify your competitor's strategy? Do any trends expose a focus on FFS providers or is the agency working more heavily with MA?
 Compare your agency with your competitors, or with your agencies in other regions
All metrics and trends found in the tables can be used to compare any agencies of interest. To compare agencies in different states, you will need to either create a custom list of agencies, or export tables of metrics from different regions and combine them. These steps are described below.
We will use the following image to show some of the more useful insights you can glean from this table.
![]() Click on the image to enlarge it.
Click on the image to enlarge it.

![]() "My Agency" - Any home health agencies that are assigned to your company as a "My Agency" in Trella Insights will appear in bold in this table. The "My Agency" in this example is Wellspan VNA Home Care, and it has the largest market share in the selected region.
"My Agency" - Any home health agencies that are assigned to your company as a "My Agency" in Trella Insights will appear in bold in this table. The "My Agency" in this example is Wellspan VNA Home Care, and it has the largest market share in the selected region.
![]() Top Competitors - A quick glance at the "Recent Four Quarters" column quickly identifies the agencies that are admitting a significant number of patients who reside in the selected region. In the above example, apart from Wellspan, which is my agency, there are a dozen other agencies that admitted a countable number of patients which means that we can observe their growth and market share.
Top Competitors - A quick glance at the "Recent Four Quarters" column quickly identifies the agencies that are admitting a significant number of patients who reside in the selected region. In the above example, apart from Wellspan, which is my agency, there are a dozen other agencies that admitted a countable number of patients which means that we can observe their growth and market share.
![]() Trended metrics - Looking at the metrics for a single agency across a row, we can look for changes to the number of admitted patients or to the market share over eight quarters of metrics.
Trended metrics - Looking at the metrics for a single agency across a row, we can look for changes to the number of admitted patients or to the market share over eight quarters of metrics.
![]() Remember that the most recent quarter of home health admission will be slightly smaller.
Remember that the most recent quarter of home health admission will be slightly smaller.
![]() % Change Admits - For the home health agency listed in each row, this metric compares the most recent four quarters of admits to the prior four quarters of admits to show the percentage of growth or loss between the two years. In general, you want to see a positive percentage in this metric to indicate that you have increased the number of patients admitted year over year.
% Change Admits - For the home health agency listed in each row, this metric compares the most recent four quarters of admits to the prior four quarters of admits to show the percentage of growth or loss between the two years. In general, you want to see a positive percentage in this metric to indicate that you have increased the number of patients admitted year over year.
![]() For details on this calculation, see Understanding % Change Admits.
For details on this calculation, see Understanding % Change Admits.
![]() Market Share Change - This metric is the percent change in the market for the agency listed in the row. A positive percentage means that the listed agency has gained market share.
Market Share Change - This metric is the percent change in the market for the agency listed in the row. A positive percentage means that the listed agency has gained market share.
![]() Details - In general, for your agencies, the best case scenario is when both the percentage of admits and the percentage of market share increase year over year. It is possible that in a growing market, your agency could have more admissions, but a smaller market share.
Details - In general, for your agencies, the best case scenario is when both the percentage of admits and the percentage of market share increase year over year. It is possible that in a growing market, your agency could have more admissions, but a smaller market share.
![]() For more information, see How can my Patient Count go up and my Market Share go Down?
For more information, see How can my Patient Count go up and my Market Share go Down?
![]() Saving a custom list - As you identify the competition in a specific market, you can save the list of agencies in a custom list so that you can view the list of agencies for a more in depth comparison on the Explore page. To do so:
Saving a custom list - As you identify the competition in a specific market, you can save the list of agencies in a custom list so that you can view the list of agencies for a more in depth comparison on the Explore page. To do so:
- Click on the check box to the far left of each row with a competitor you want to add to the list
- Click on the mysterious icon
 above the table
 - A dialog box will open that will allow you to save the list
- On the Home Health Agencies Explore page, use the "Custom List" filter to select the list you created
- The table will show the chosen home health agencies
![]() <11 and ins - This table will almost always show a lot of home health agencies that don't admit enough patients to show a count (<11) and for which we are not able to calculate a market share (ins).
<11 and ins - This table will almost always show a lot of home health agencies that don't admit enough patients to show a count (<11) and for which we are not able to calculate a market share (ins).
![]() For more information see Data and Metrics - <11, ins, and hyphen "-"
For more information see Data and Metrics - <11, ins, and hyphen "-"
![]() Agency Count - To get an idea of the breadth of agencies that admitted patients from the selected region, the count is provided at the bottom right, below the table. In this case, 104 agencies admitted a countable number of patients during a period of time displayed in the table.
Agency Count - To get an idea of the breadth of agencies that admitted patients from the selected region, the count is provided at the bottom right, below the table. In this case, 104 agencies admitted a countable number of patients during a period of time displayed in the table.
Medicare Advantage - State or County Totals
This table includes trended annual Medicare Advantage enrollee counts and admission counts to home health care and skilled nursing care.
![]() The most recent complete data for MA metrics is about 2 years older than the most recent Medicare FFS metrics available in Trella Insights. Keep this in mind when you compare the Medicare Advantage metrics on this page to the Medicare FFS metrics.
The most recent complete data for MA metrics is about 2 years older than the most recent Medicare FFS metrics available in Trella Insights. Keep this in mind when you compare the Medicare Advantage metrics on this page to the Medicare FFS metrics.

![]() Highlighted column - normally the most recent column of patient counts in Trella Insights for Home Health is highlighted to indicate that the metric is incomplete. This does not apply to Medicare Advantage metrics, nor does it apply to counts of enrollees or admissions. In short, the column should not be highlighted and you can consider the counts in this column as complete and accurate.
Highlighted column - normally the most recent column of patient counts in Trella Insights for Home Health is highlighted to indicate that the metric is incomplete. This does not apply to Medicare Advantage metrics, nor does it apply to counts of enrollees or admissions. In short, the column should not be highlighted and you can consider the counts in this column as complete and accurate.
Columns | |
| First Column (Unnamed) | The first column identifies the type of counts in the row |
| Trended years (20XX) | Each metric is the count of the patient type listed in each row who resided in the selected region (county or counties) for the year identified in the column header. |
Rows | |
|
Medicare Advantage Enrollees |
This is the count of patients enrolled in Medicare Advantage residing in the selected state or county/counties during the period listed in the column header. |
| Home Health Admissions | This metric is the count of admissions of Medicare Advantage patients to home health care during the period listed in the column header. |
| Skilled Nursing Admissions | This is the count of admissions of Medicare Advantage patients to skilled nursing care during the period listed in the column header. |
![]() Enrollees - These metrics are counts of patients enrolled in FFS or MA based on the Master Beneficiary Summary File, not from Medicare FFS or MA claims.
Enrollees - These metrics are counts of patients enrolled in FFS or MA based on the Master Beneficiary Summary File, not from Medicare FFS or MA claims.
![]() For more information, see ResDAC's article: Enrollment Source.
For more information, see ResDAC's article: Enrollment Source.
Usage
-
Patient Population
- This table establishes a baseline for understanding the Medicare Advantage Market Share table below it.
- The counts of enrollees and admissions are the "pool" of patients who resided in your selected region.
- When you evaluate your home health agency or agencies in the Market Share table below, you can see how the counts of admissions at your agency are used to created the market share percentages from the population totals.
-
Patient Population Trends
- In addition to the counts of enrollees, mortalities and admissions, you can also see how counts of patients have trended annually over a five year period.
Medicare Advantage - State or County Market Share
![]() Click on the image to enlarge it.
Click on the image to enlarge it.
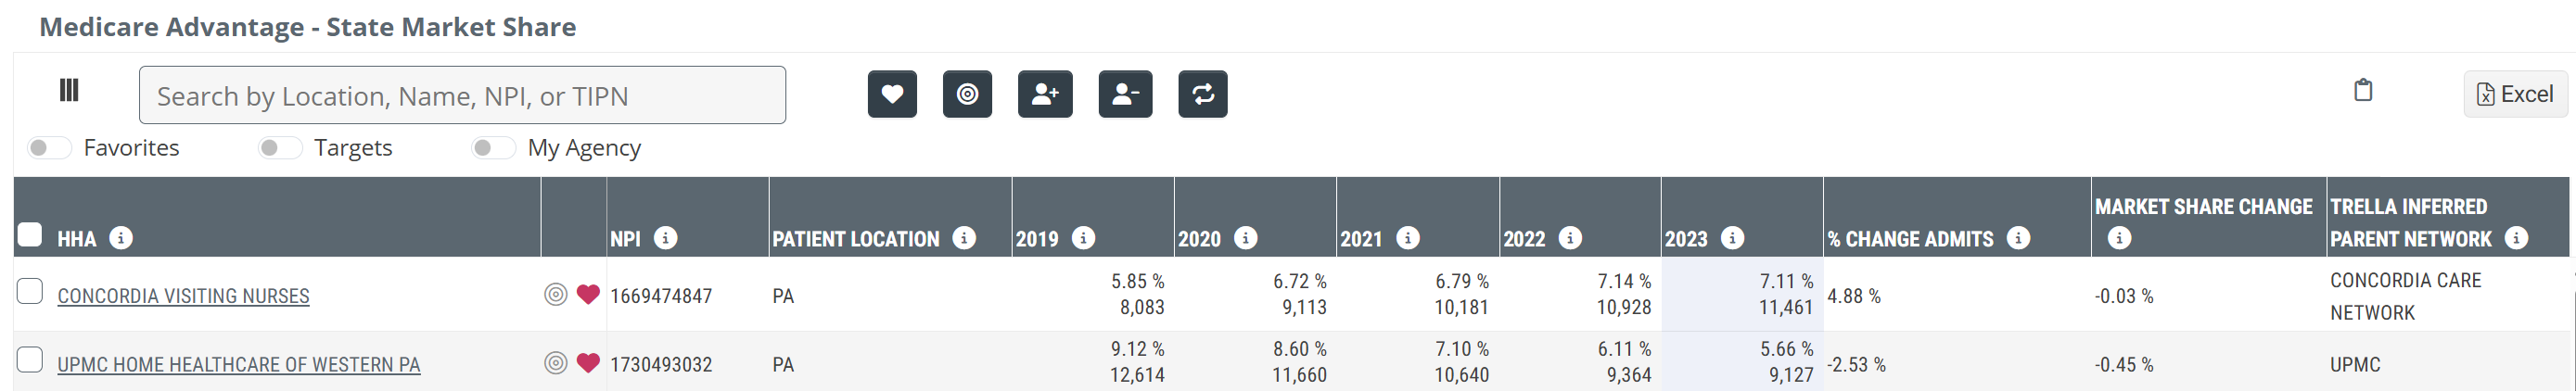
![]() Highlighted column - normally the most recent column of patient counts in Trella Insights for Home Health is highlighted to indicate that the metric is incomplete. This does not apply to Medicare Advantage metrics, nor does it apply to counts of enrollees or admissions. In short, the column should not be highlighted and you can consider the counts in this column as complete and accurate.
Highlighted column - normally the most recent column of patient counts in Trella Insights for Home Health is highlighted to indicate that the metric is incomplete. This does not apply to Medicare Advantage metrics, nor does it apply to counts of enrollees or admissions. In short, the column should not be highlighted and you can consider the counts in this column as complete and accurate.
| Column | Description |
| HHA/NPI | This is the name of the home health agency and NPI as listed in the CMS Provider Data (NPI) file. |
| Patient Location | This is the county and/or state from which the metrics in the row are calculated. Therefore, the location represents the residence of the patient, not the agency location. |
|
5 Trended years - 20XX The annual metrics and the quarterly metrics are calculated the same way.
Top/Bottom - Each Cell includes two metrics
|
Two metrics Top - This is the percentage of Medicare Advantage patients who resided in the listed patient location who were admitted to the agency listed in the row during the year identified in the header. In short, this is the market share of home health patients admitted to the agency listed in the row. Bottom - This is the count of Medicare Advantage patient admissions who resided in the listed patient location who were admitted to the home health agency listed in the row during the year identified in the header. |
| % Change Admits | This is the percentage of growth or loss of patient census for the agency listed in the row. For calculation details, see below. |
| Market Share Change |
This percentage is the change in market share between the most recent four quarters compared to the previous four quarters. For calculation details, see below. |
| Trella Inferred Parent Network | A corporate parent entity for a collection of NPI's that has been identified by Trella as an owner, operator, or manager of multiple healthcare providers, using CMS Ownership data in addition to other data sources. |
Metrics Calculation
The metrics in the Medicare Advantage Market Share table are calculated in the same way as the metrics in the Medicare FFS Market Share table.
![]() For the calculation details, see Metrics Calculation.
For the calculation details, see Metrics Calculation.
Usage
The use case for the Medicare Advantage Market Share metrics is the same as the Medicare FFS Market Share metrics.
![]() For usage ideas, see Medicare FFS Market Share table usage.
For usage ideas, see Medicare FFS Market Share table usage.
Understanding % Change Admits
The % Change Admits is not the change in Market Share, it is the percent of growth or loss of patient census based on the claims over a two year period.

![]() In order to calculate the % Change Admits column in this table, we compare the admission counts from the most recent four quarters of data with the previous four quarters. The most recent four quarters are summed to create a count, and the previous four quarters are summed to generate another count. As you can see from the image below, we calculate the percent change using the following steps:
In order to calculate the % Change Admits column in this table, we compare the admission counts from the most recent four quarters of data with the previous four quarters. The most recent four quarters are summed to create a count, and the previous four quarters are summed to generate another count. As you can see from the image below, we calculate the percent change using the following steps:
- Sum the patient counts from the most recent four quarters - this is our Most Recent count. Example: 128+139+123+96 = 486 patients.
- Sum the patient counts from the previous four quarters - this is our Previous count. Example: 123+114+112+130 = 439 patients.
- Subtract the Previous count from the Most Recent count - this is the difference between the two periods. If this subtraction yields a negative number, this signifies a drop in patient census over the two periods and will show as a negative percent change. For our example; 486-439 = 47
- Divide the difference by the Previous count - 47 / 439 = .1070
- Multiply by 100% to get a percentage - 10.7 %
- This number is the % change in patient census from the two one-year periods.

Wait! Where did 439 come from?
Most recent HHA Data
Home Health data for the most recent quarter is always incomplete - the counts are always lower during that quarter. As a result, the patient counts for the most recent four quarters will be short and therefore can't be compared with the previous four quarters to calculate a % change.
![]() For more information on the most recent quarter of home health metrics, see Why is the Latest Quarter of Home Health Metrics Lower and Highlighted?
For more information on the most recent quarter of home health metrics, see Why is the Latest Quarter of Home Health Metrics Lower and Highlighted?
So what do we do?
![]() We do a quarter by quarter and overall comparison of patient counts between the previous four quarters and the most recent four quarters and we create an estimate for the previous four quarters. This allows us to use the estimated count to calculate the % change.
We do a quarter by quarter and overall comparison of patient counts between the previous four quarters and the most recent four quarters and we create an estimate for the previous four quarters. This allows us to use the estimated count to calculate the % change.
Market Share Change
Market share is the percentage of HHA patients for the selected region admitted to the selected HHA agency in the row.
![]() To calculate a market share for any period, divide the agency's admissions for the period by the county (or state) admissions for the same period - multiply by 100%.
To calculate a market share for any period, divide the agency's admissions for the period by the county (or state) admissions for the same period - multiply by 100%.
![]() To calculate a market share change for any period, subtract the previous market share from the most recent market share.
To calculate a market share change for any period, subtract the previous market share from the most recent market share.
First, we calculate the Market Share for the most recent four quarters. (Color boxes are included to help you to find the calculation in the image below.)
-
 Agency's total for most recent four quarters - 42 + 52 + 60 + 66 = 220
 -
 County total for most recent four quarters - 457 + 590 + 585 + 524 = 2,156
 - Market share for most recent four quarters = 220/2,156 = 10.20%
Next, we calculate the market share for the previous four quarters:
-
 Agency's total for previous four quarters - 63 + 75 + 67 + 69 = 274
 -
 County total for previous four quarters - 586 + 591 + 656 + 601 = 2,343
 - Market share for previous four quarters = 274/2,343 = 11.69%
Market Share Change = Most Recent percent - Previous percent - 10.20% - 11.69% = -1.41%. This is the change in market share for the selected post-acute agency year over year.
The following image shows where you can find the metrics for this calculation. Quarterly counts for the the county/state will appear in the top table - County Totals, or State Totals. Quarterly counts for the agency will appear for each agency in the Market Share table. We have removed rows not used in this calculation.

 What if my agency is on a state border?
If your agency is near a state border and you want to make a unified evaluation of that market, follow these steps:
-
Step 1:
- Choose the County Report type
- Select the county or counties for the first state
- Option 1: Excel - Export the Market Share table to an Excel Spreadsheet by clicking the Excel button at the top right of the table -

- Option 2: Create a custom list
- Click on the check boxes to the left of the agencies of interest in the Market Share table
- Click the button and create a custom list
- Add the selected agencies
-
Step 2:
- Change the state and counties to the second state
- Continue Option 1: Excel
- Export the refreshed data from the second state by clicking the Excel button at the top right of the table -
- Combine the data from the two spreadsheets
- Export the refreshed data from the second state by clicking the Excel button at the top right of the table -
- Continue Option 2: Custom list
- Click on the check boxes to the left of the home health agencies you want to compare
- Click the button and select the custom list you previously created
- Add the selected agencies
- You can now use the custom list filter on the Home Health Agencies Explore page to see all of your selected home health agencies together.