Overview
The Patient Population tab of the Physician Analyze Page of Trella Health Trella Insights for Home Health makes you the expert on your selected physician's patients. These metrics are found under the Patient Population Tab.
Location
The content in this article pertains to tables and metrics found under the Patient Population tab.

 In this article
- Chart View - Summary of the Chart View on the Analyze page
- Patient Volume - Historical counts of patients by several different criteria
- CMS Payer Mix - Distinct Patients - Trended patient counts for Medicare FFS, Medicare Advantage, and Medicaid
- Patient Locations - County - percentages of patient's by county of residence
- Patient Diagnostic Mix - counts of patients in each Trella Health Diagnostic Group
- Chronic Conditions - counts of the selected physician's patients with specific chronic conditions
- Patient Age Metrics - Breakdown of patients by age
Chart View
At the top left of the page you will find a toggle icon that allows you to turn chart view on and off. With chart view on, some content will be shown as a chart, with chart view off, most content on the page will be shown in tables.
![]() Not all tables have a chart view, and some charts don't have a table view.
Not all tables have a chart view, and some charts don't have a table view.
Chart View On |
Chart View Off |
 |
 |
|
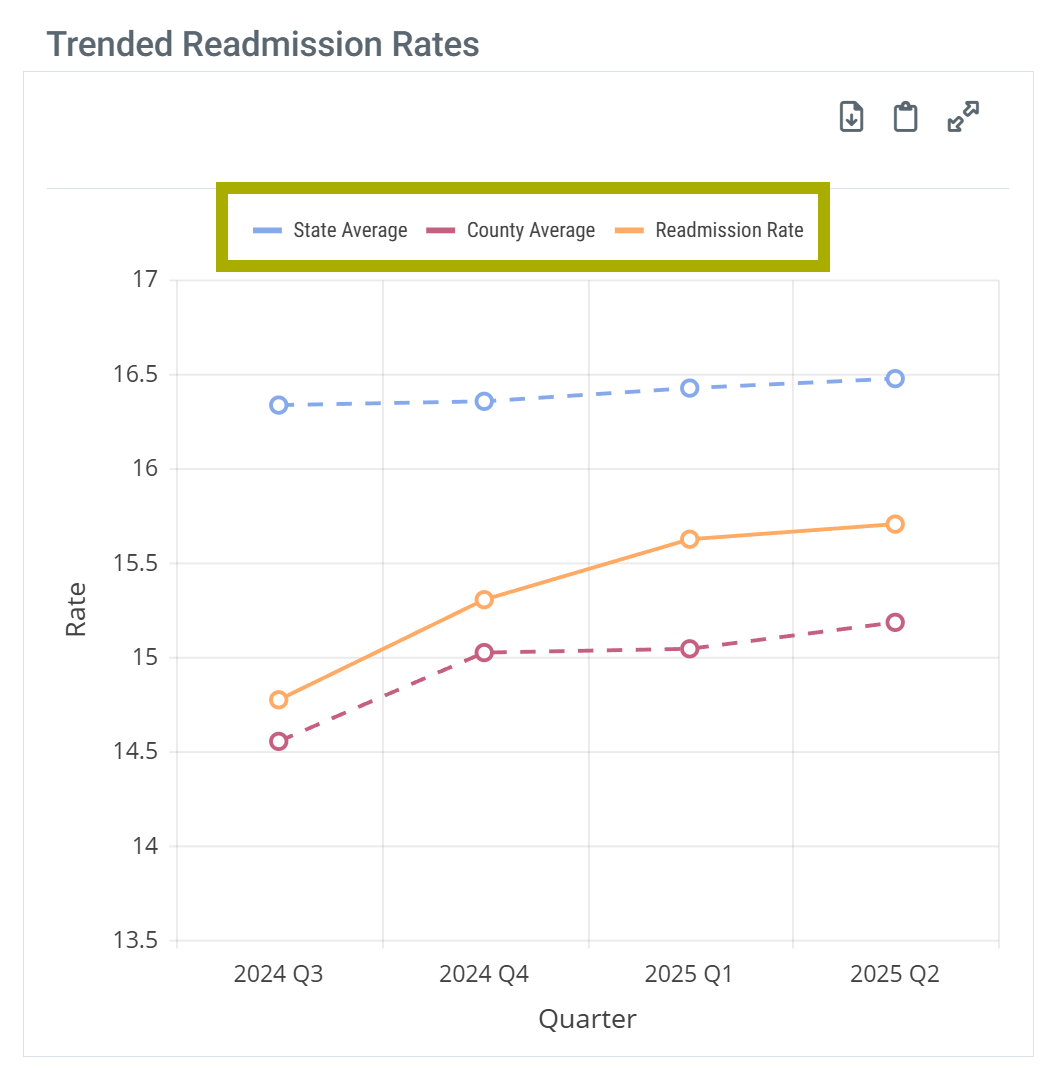
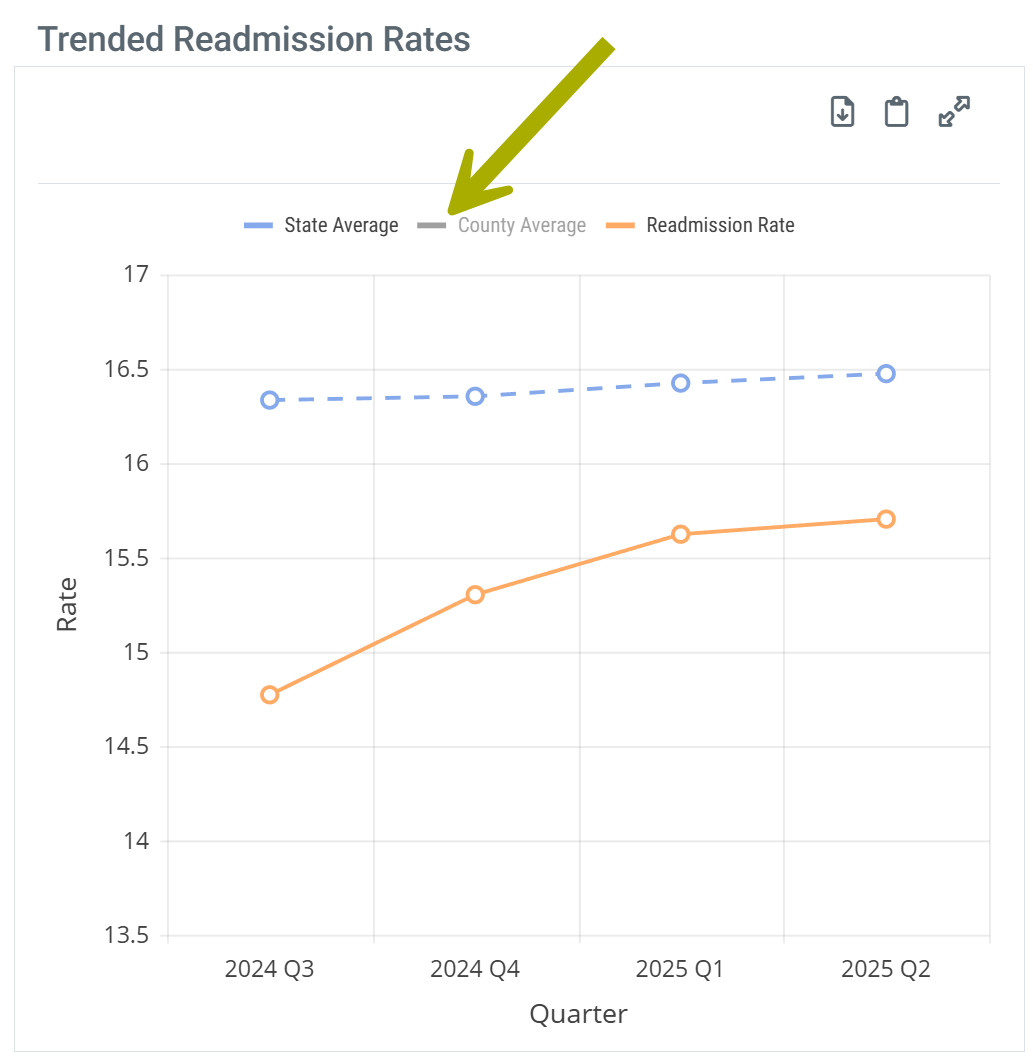
Legend - Some charts have a legend that identifies the elements in the chart. Each different identifier in the legend can be toggled on and off to display or hide the matching elements in the chart. Hovering over an identifier highlights the related elements in the chart.
| |
 |
 |
Understanding the Metrics
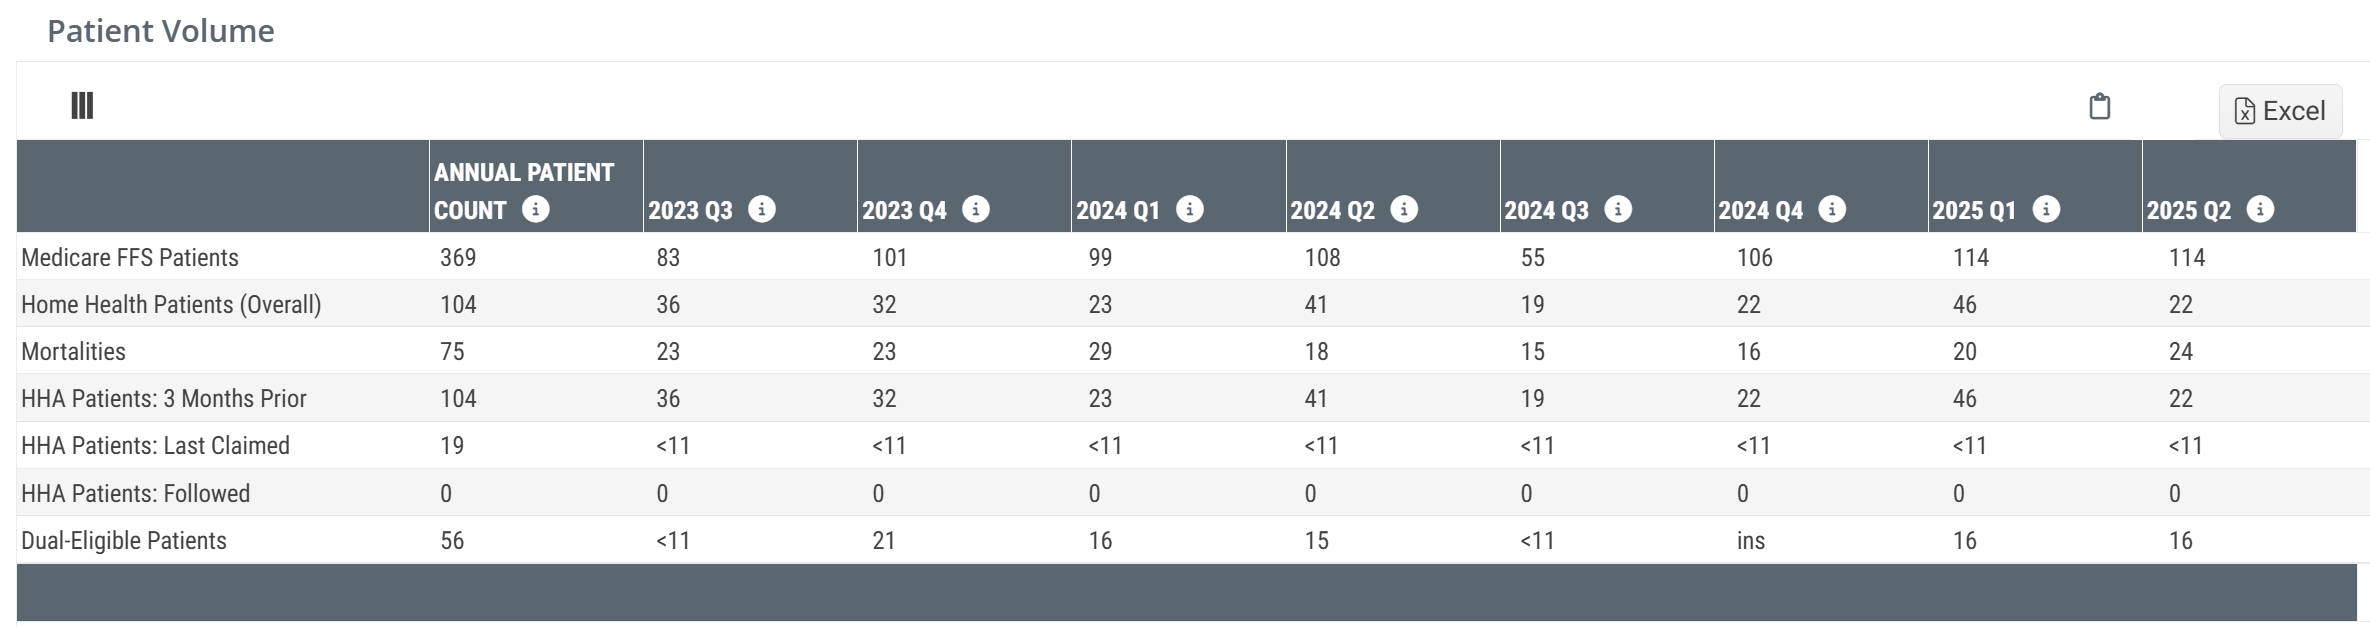
Patient Volume Table
The Patient Volume table includes metrics on the patient population for the selected physician so you can gauge the physician's potential for being an influence with patients regarding home health treatment.
![]() For more details about this table, see Patient Counts and Claim Types.
For more details about this table, see Patient Counts and Claim Types.
Chart View and Table View
|
Off
|
 |
|
On
|
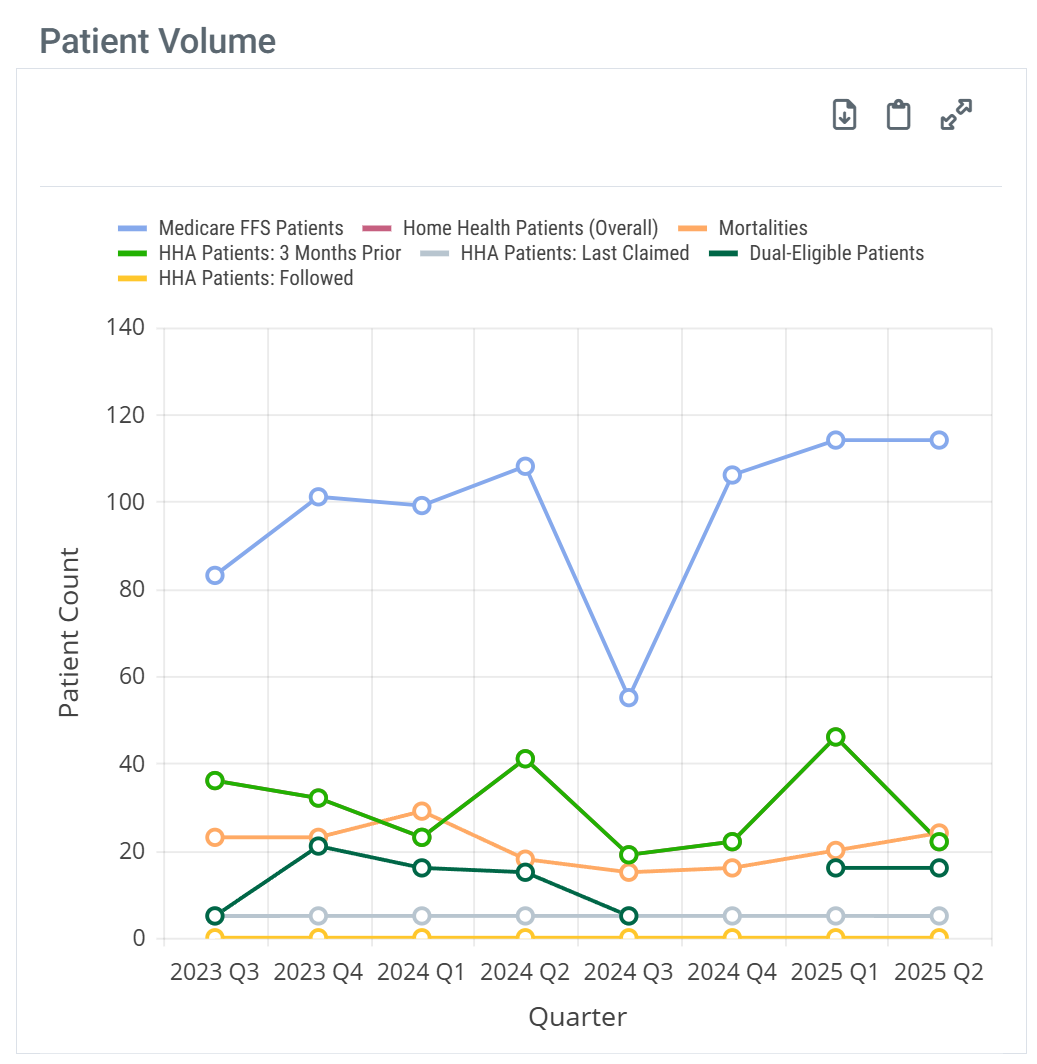 |
| When you hover over a line in the Patient Volume chart, the metrics for the different patient counts represented in the column are displayed. | 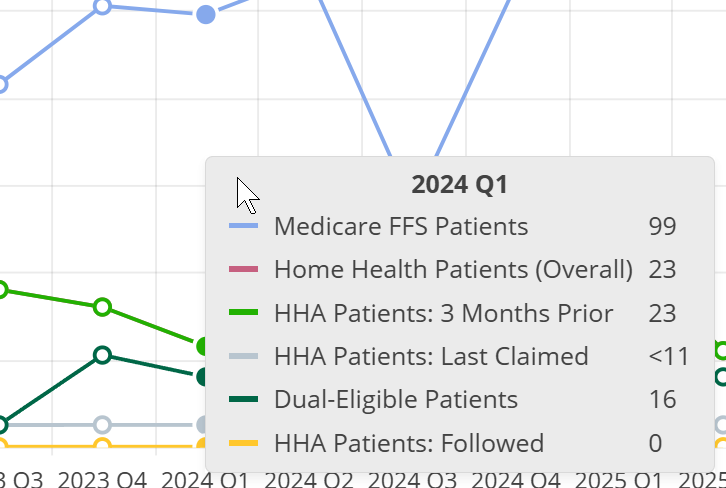 |
|
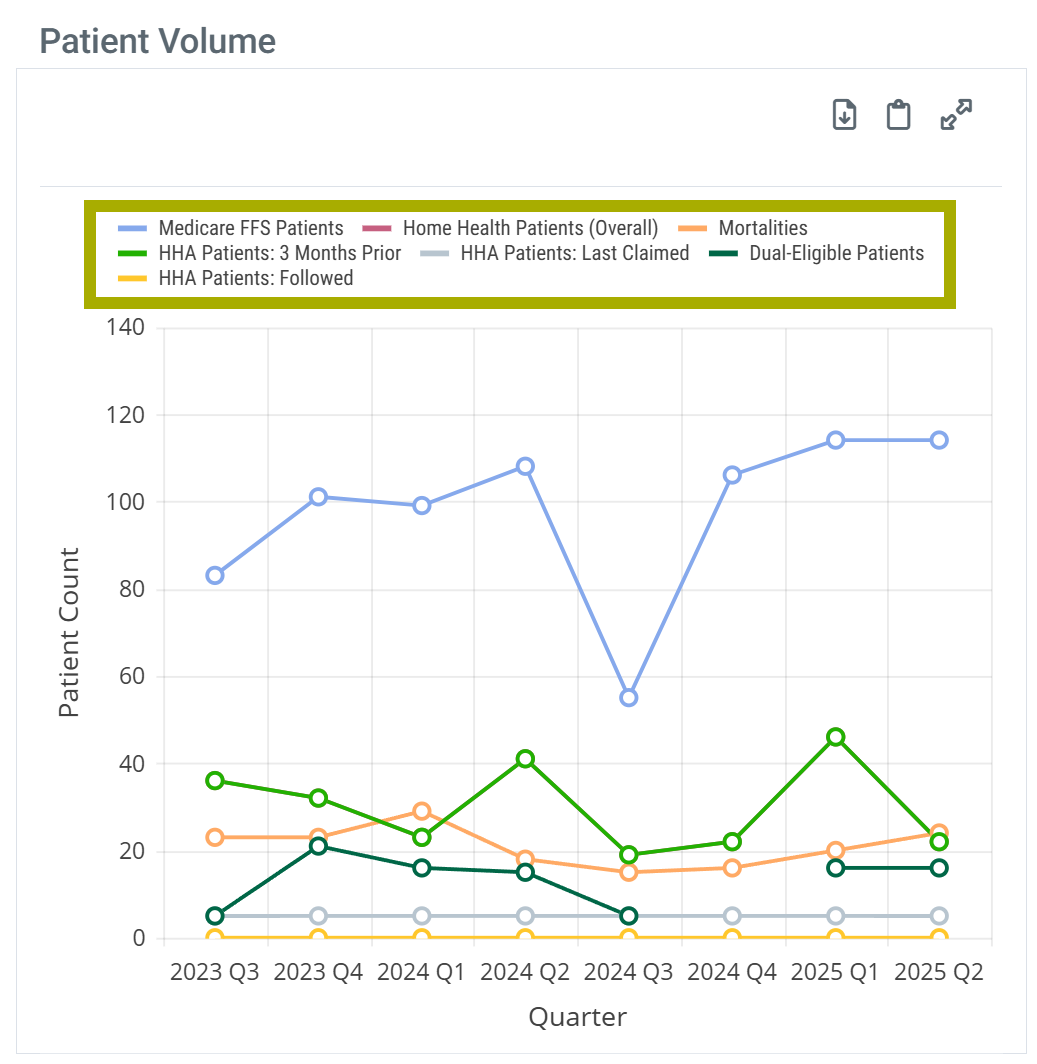
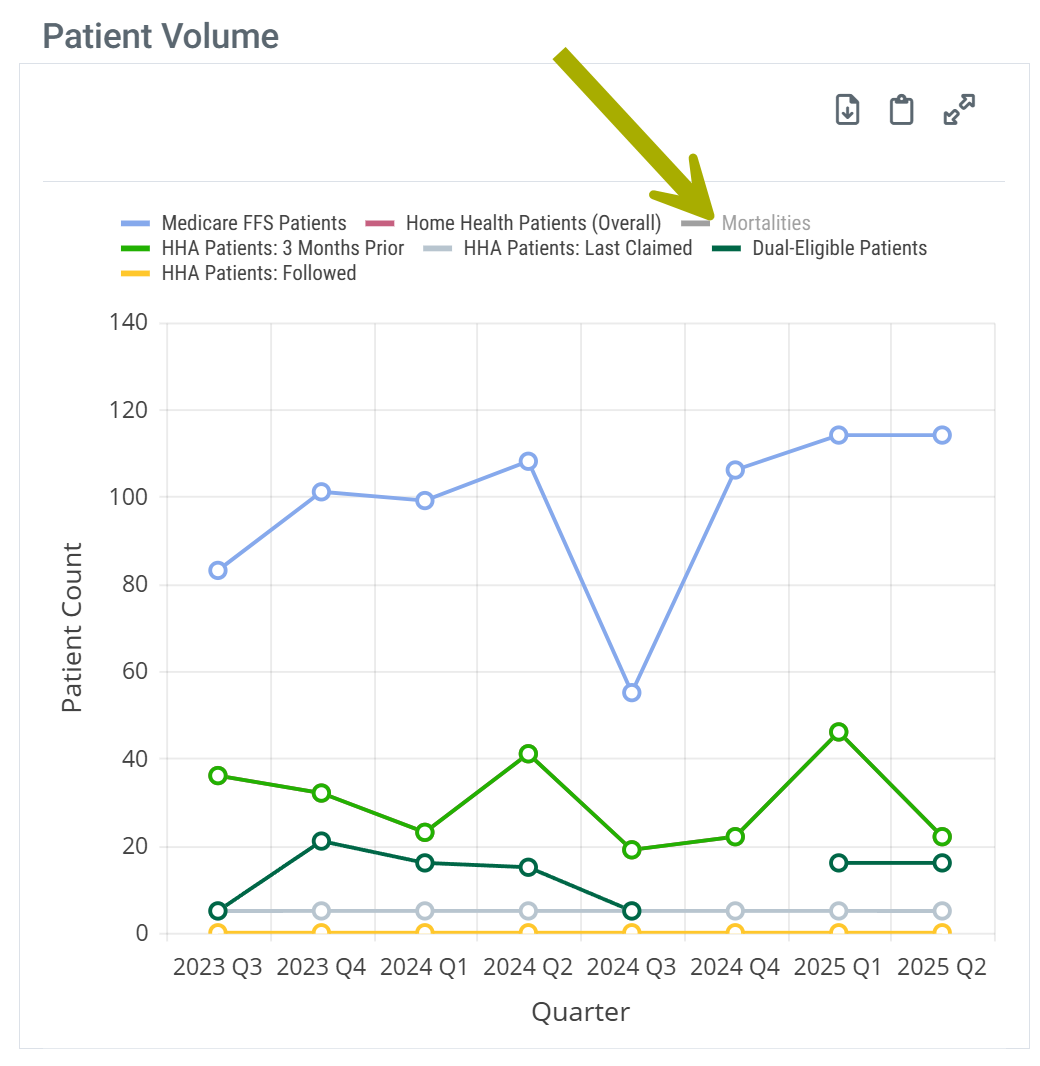
With chart view on the Patient Volume chart has a legend that identifies the elements in the chart. Each different identifier in the legend can be toggled on and off to display or hide the matching elements in the chart. Hovering over an identifier highlights the related elements in the chart.
| |
| Chart Legend | Legend Customize |
 |
 |
Metric Details
Medicare FFS Patients
Medicare FFS Patients is the count of distinct patients for which the selected physician filed a Part B claim during the most recent one year reporting period.
Home Health Patients (Overall)
This is the count of the selected physician’s distinct patients who were admitted to home health services during the reporting period. It is limited to patients who were counted under the three claim types, Patients Followed, Patients 3 Months Prior, and Last Claimed Patients. As such, it is a union of these three claim types, not a total, because a patient could be counted under more than one claim type.
Mortalities
This is the count of patients who died during the one-year reporting period who had been treated by the physician during the six month reference period prior to their date of death.
HHA Patients: Followed
This is the count of distinct patients who were admitted to home health services during the reporting period where the named physician is identified as the certifying physician on the home health claim.
HHA Patients: 3 Months Prior
Three Months Prior is the count of distinct patients where the named physician treated the patient in the 3 months prior to the patient's home health admission.
HHA Patients: Last Claimed
This metric is the number of distinct patients for whom the named physician submitted the last professional claim prior to the patient's home health admission.
Dual-Eligible Patients
Dual-Eligible Patients is a count of distinct Medicare FFS Patients treated by the physician who were eligible for Medicaid coverage during the specified quarter.
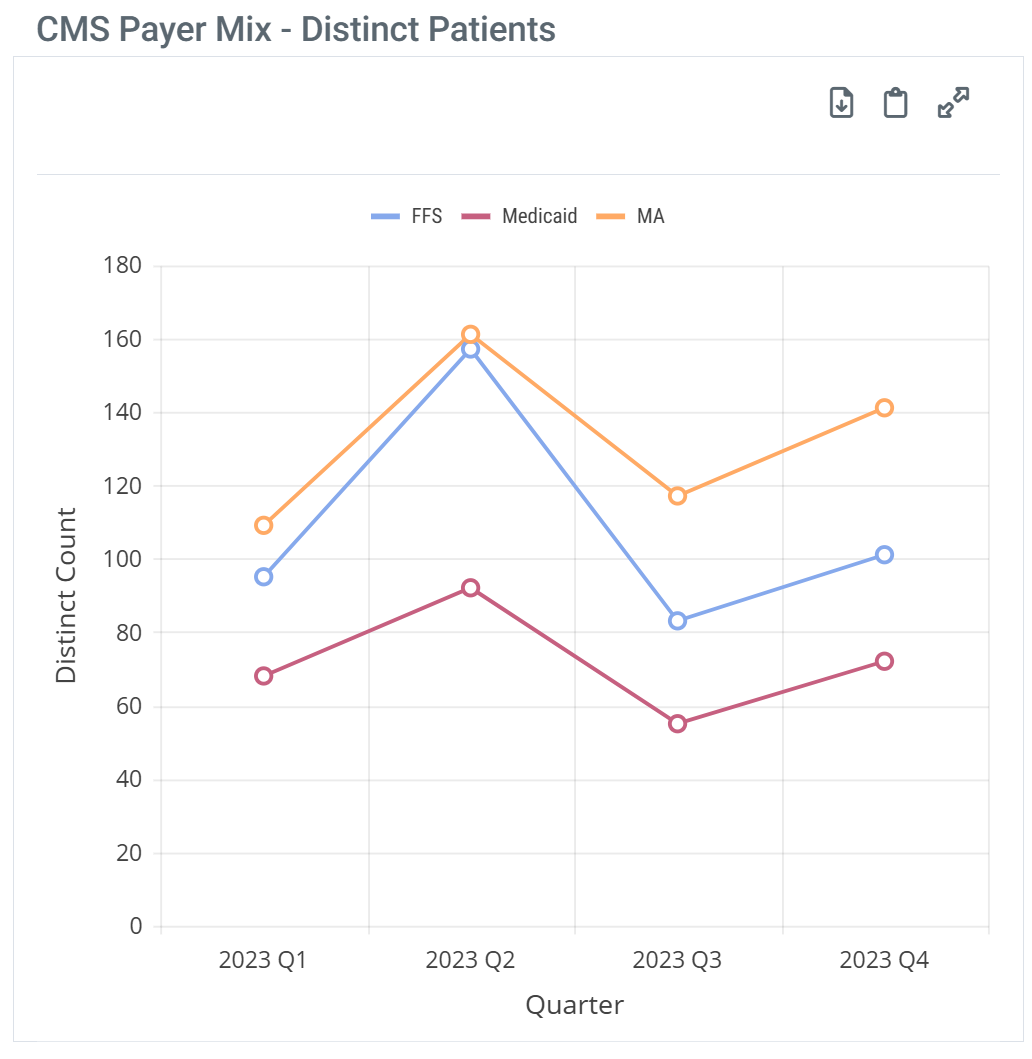
CMS Payer Mix
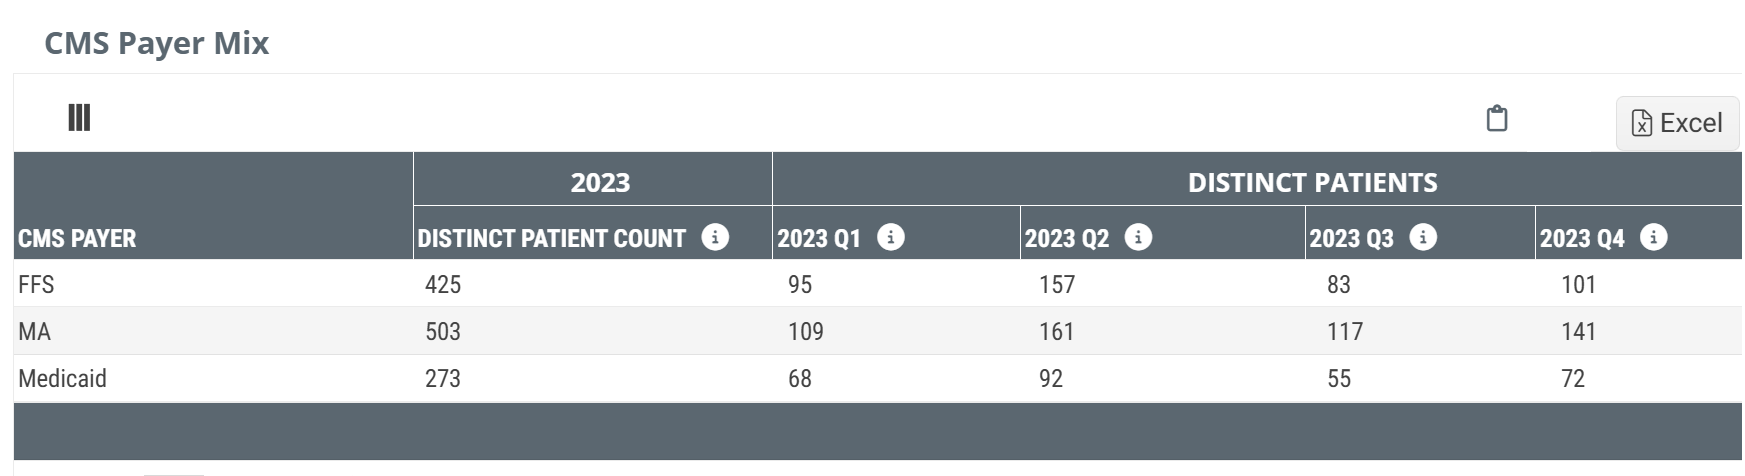
The CMS Payer Mix chart and table provide parallel trended patient counts for Medicare FFS, Medicare Advantage, and Medicaid for the most recent possible full year of metric for patients treated by the selected physician.
Chart View and Table View
|
Off
|
 |
|
On
|
 |
| When you hover over a line in the CMS Payer Mix chart, the metrics for the different patient counts represented in the column are displayed. | 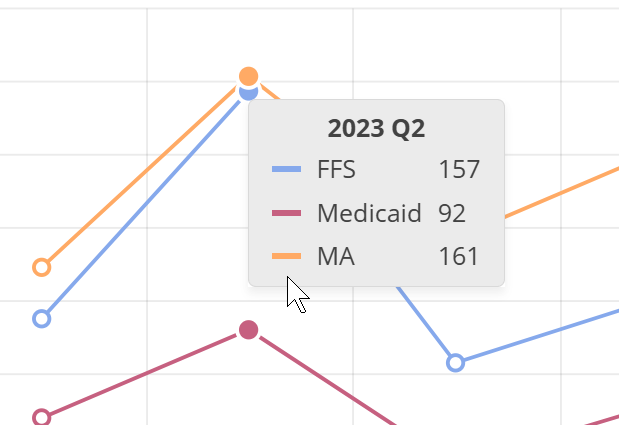 |
|
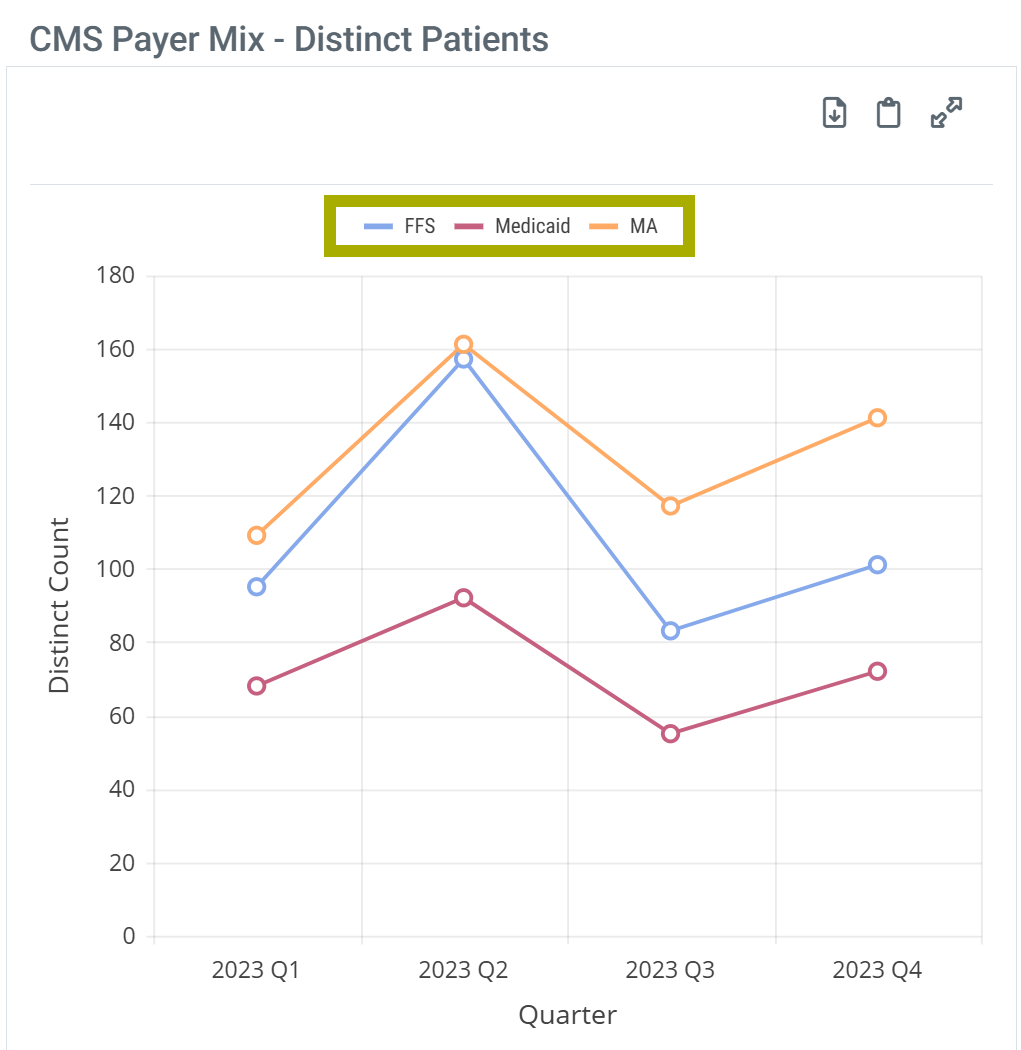
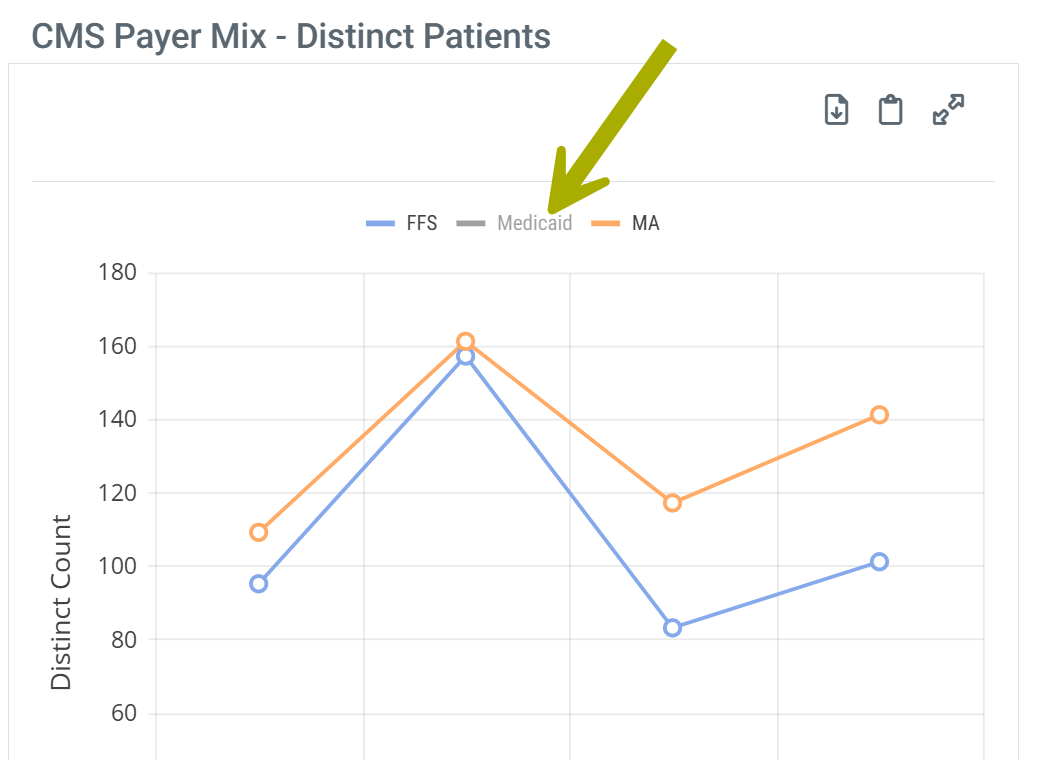
With chart view on the CMS Payer Mix chart has a legend that identifies the elements in the chart. Each different identifier in the legend can be toggled on and off to display or hide the matching elements in the chart. Hovering over an identifier highlights the related elements in the chart.
| |
| Chart Legend | Legend Customize |
 |
 |
Metric Details
This table shows the distinct patient counts for the following CMS payers:
- Medicare FFS
- Medicare Advantage
- Medicaid
The counts are for patients treated by the selected physician for the period listed in the header of each column.
![]() The date for this dataset can be found in the table header. The dates for all most recent data sets is found at the top of every page. (See image)
The date for this dataset can be found in the table header. The dates for all most recent data sets is found at the top of every page. (See image)

![]() This table will help you understand the general payer mix of potential referral sources to better determine how your agency can partner with the selected provider.
This table will help you understand the general payer mix of potential referral sources to better determine how your agency can partner with the selected provider.
![]() Counts displayed are based on the most recent data available for 100% of FFS, MA, and Medicaid provided by CMS. Distinct patient counts are based on the FFS, MA, and Medicaid claims submitted by the NPI and therefore the same patient may be included in multiple payer groups during the same time period.
Counts displayed are based on the most recent data available for 100% of FFS, MA, and Medicaid provided by CMS. Distinct patient counts are based on the FFS, MA, and Medicaid claims submitted by the NPI and therefore the same patient may be included in multiple payer groups during the same time period.
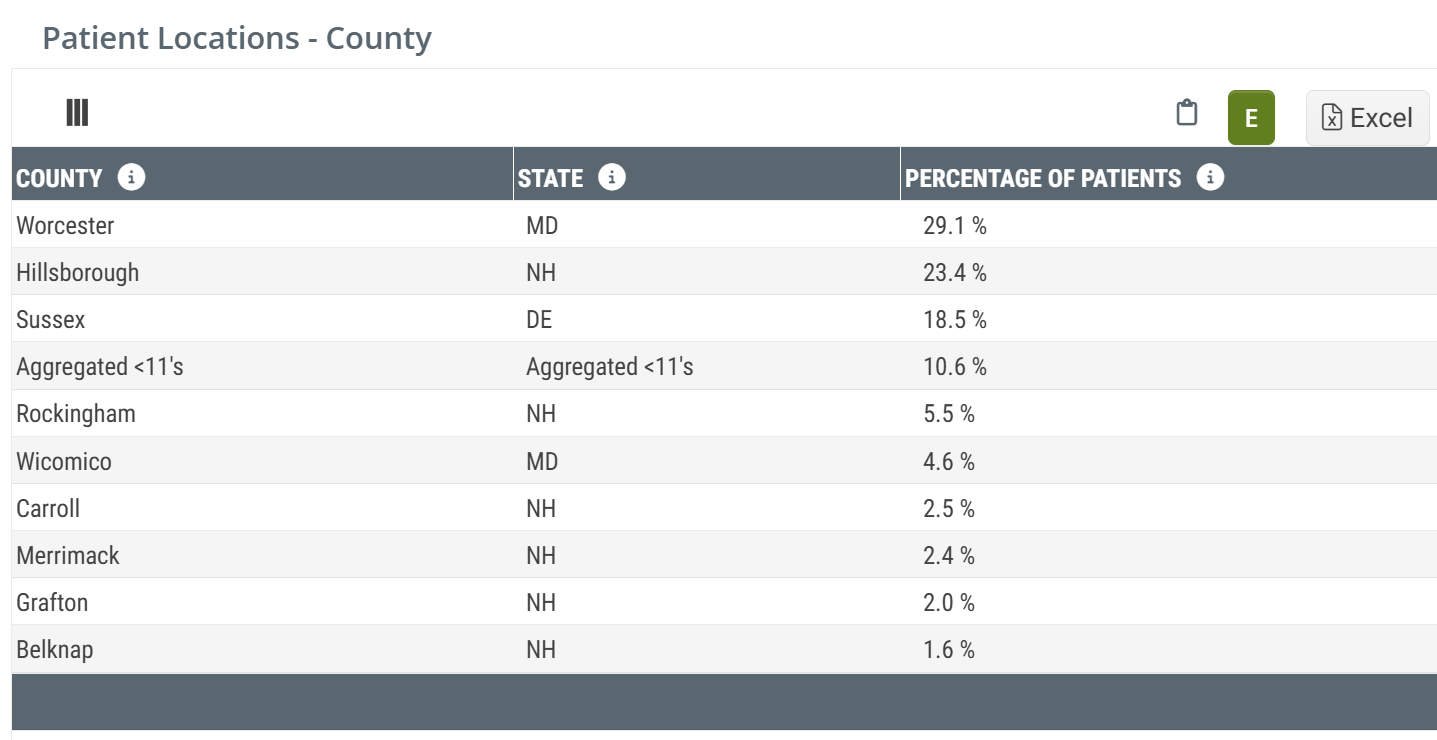
Patient Locations - County
The Patient Location - County table and chart shows the percentage of patients treated by the selected physician within the two year reference period who resided in the listed county at the time their home health admission claim was filed. The two year reference period aligns with the end of the last quarter for the data set included in Trella Insights.
The patient percentages in this table are calculated from all Medicare claims for the selected physician.
Chart View and Table View
|
Off
|
 |
|
On
|
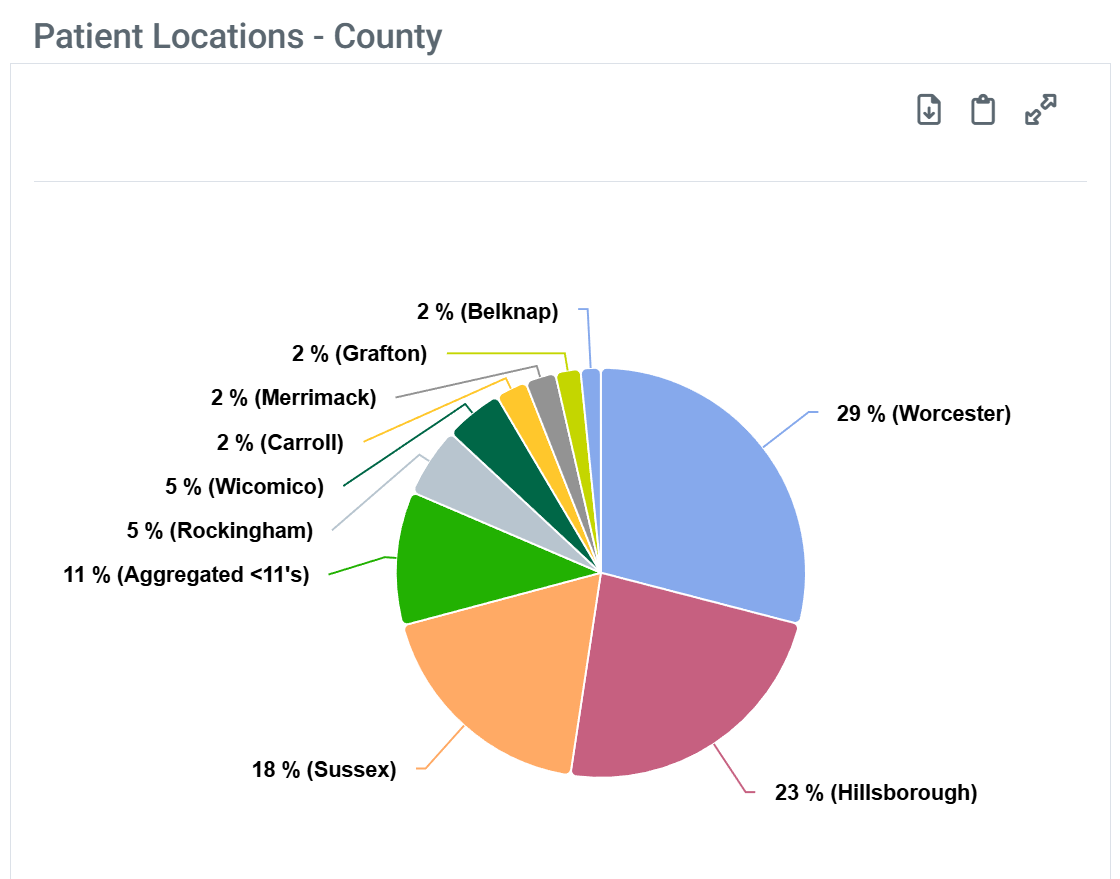 |
| When you hover over a sector in the Patient Location chart, the metrics for that sector is displayed. | 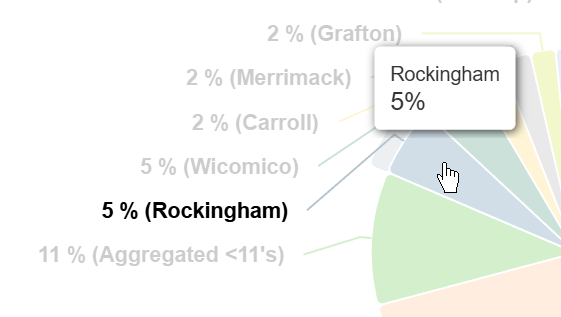 |
Metric Details
For the selected physician, this table contains the names of the counties and the percentage of patients for each county from the physician's total patient count.
Since these metrics are based on the patients' place of residence, it is possible to have counties from states other than the state of the physician's practice. This will be especially true for physicians who practice in smaller states or near state lines. For physicians who primarily examine clinical records, (X-rays, EKGs, etc.), there could be numerous counties from all over the country.
Aggregated <11s
- Any and all counties where the percentage was calculated from a count of less than 11 patients will not be identified in the table but will be aggregated into the row titled, "Aggregated <11s."
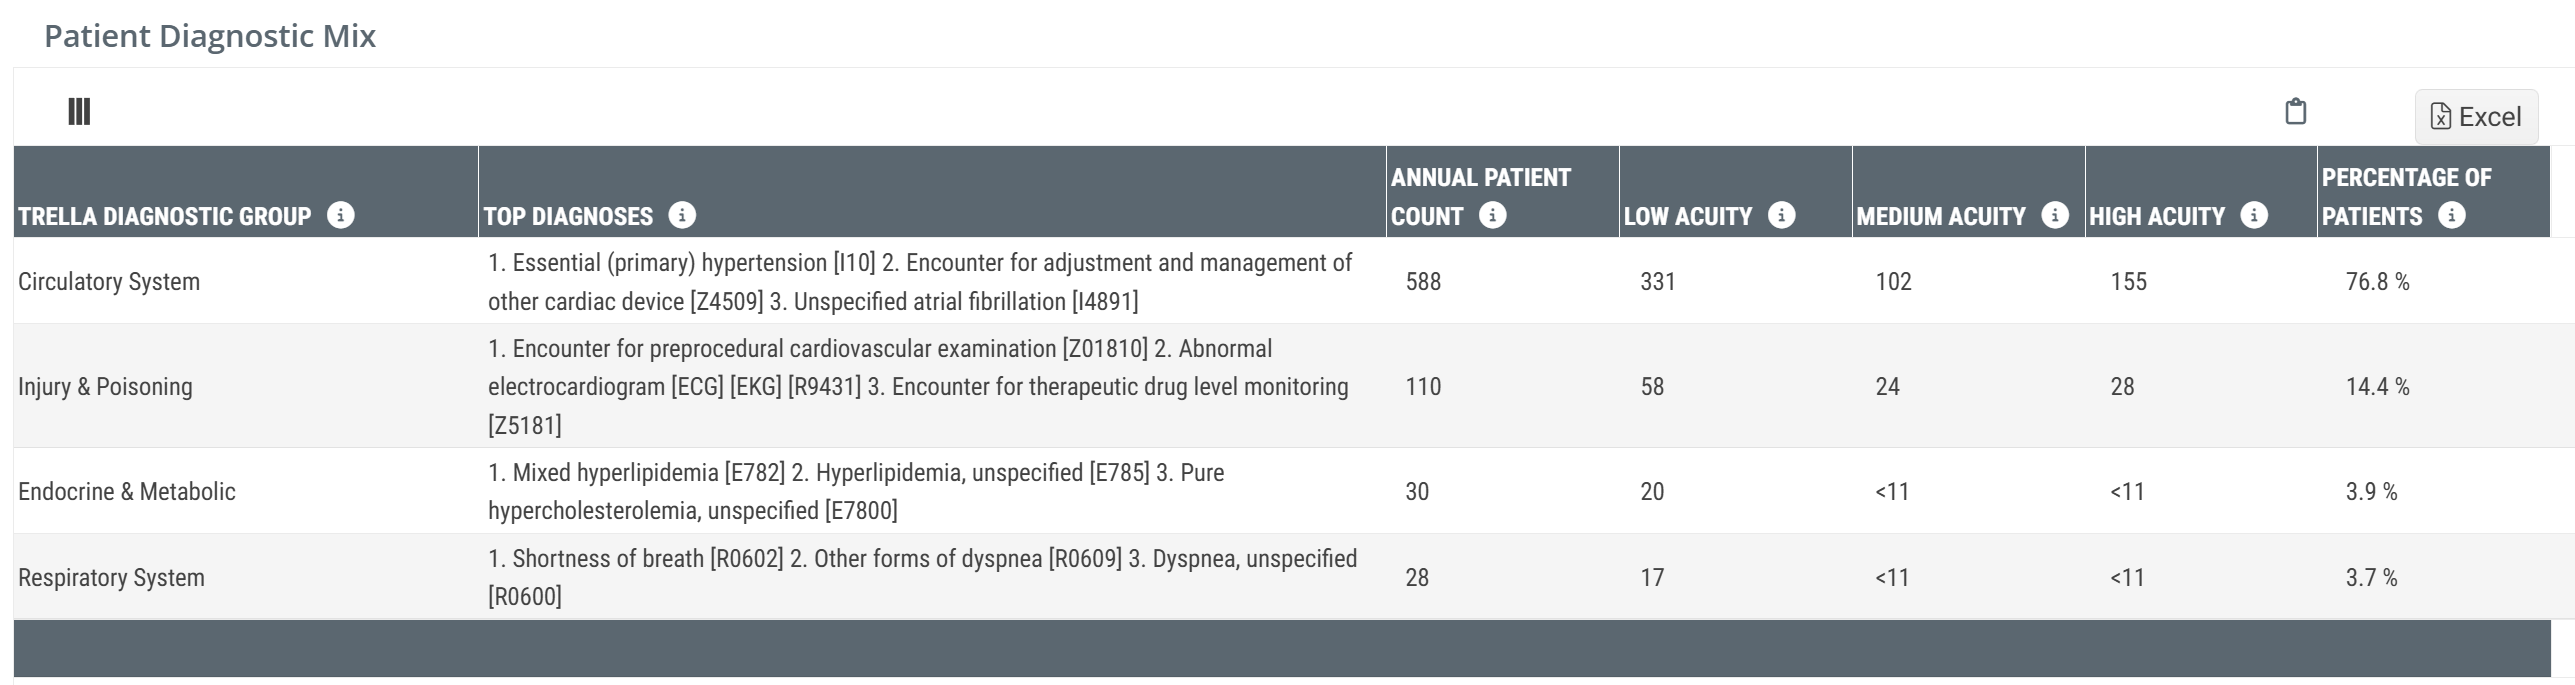
Patient Diagnostic Mix
This table breaks down the selected physician's patients by the principle diagnosis indicated on the claim. For each diagnosis, we provide a total count and then we breakout the total count into acuity levels, low, medium, and high.
Chart View and Table View
|
Off
|
 |
|
On
|
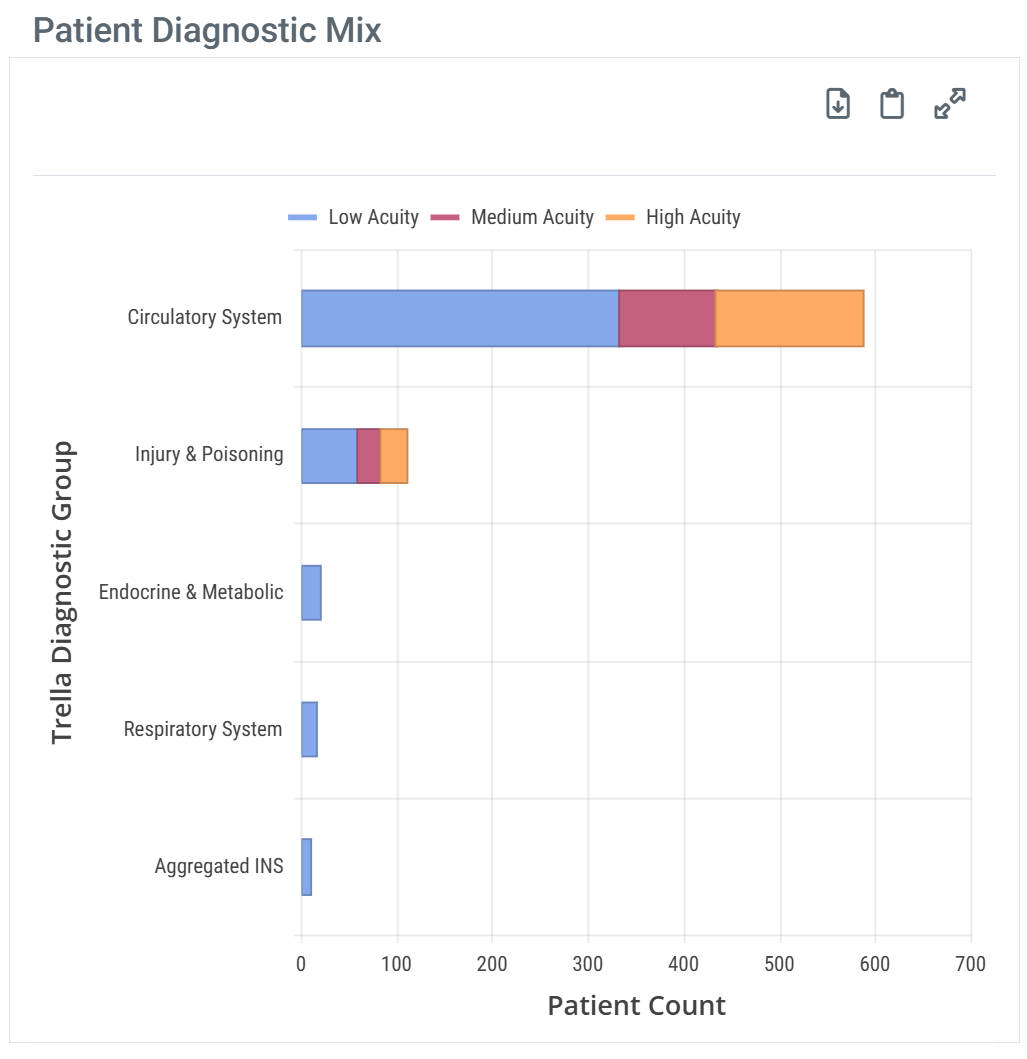 |
| When you hover over a bar in the Patient Diagnostic Mix chart, the metrics for the different patient counts represented in the chart are displayed. | 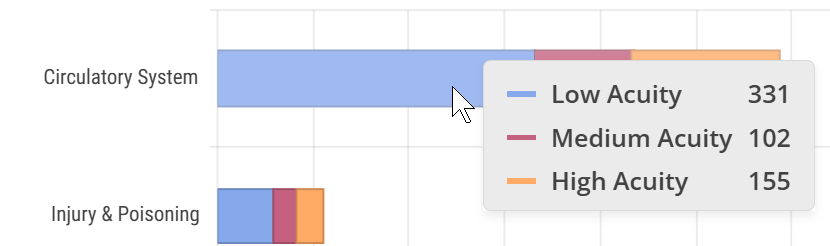 |
|
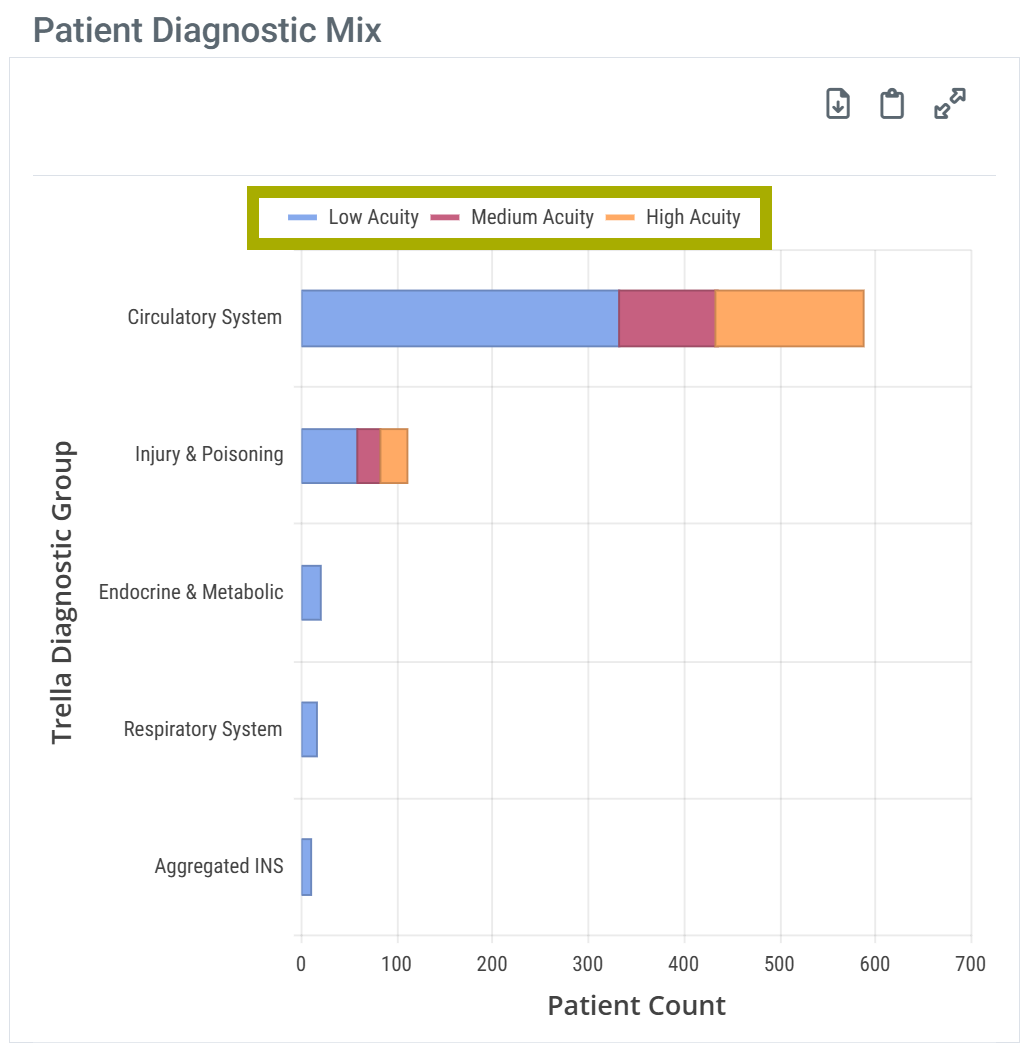
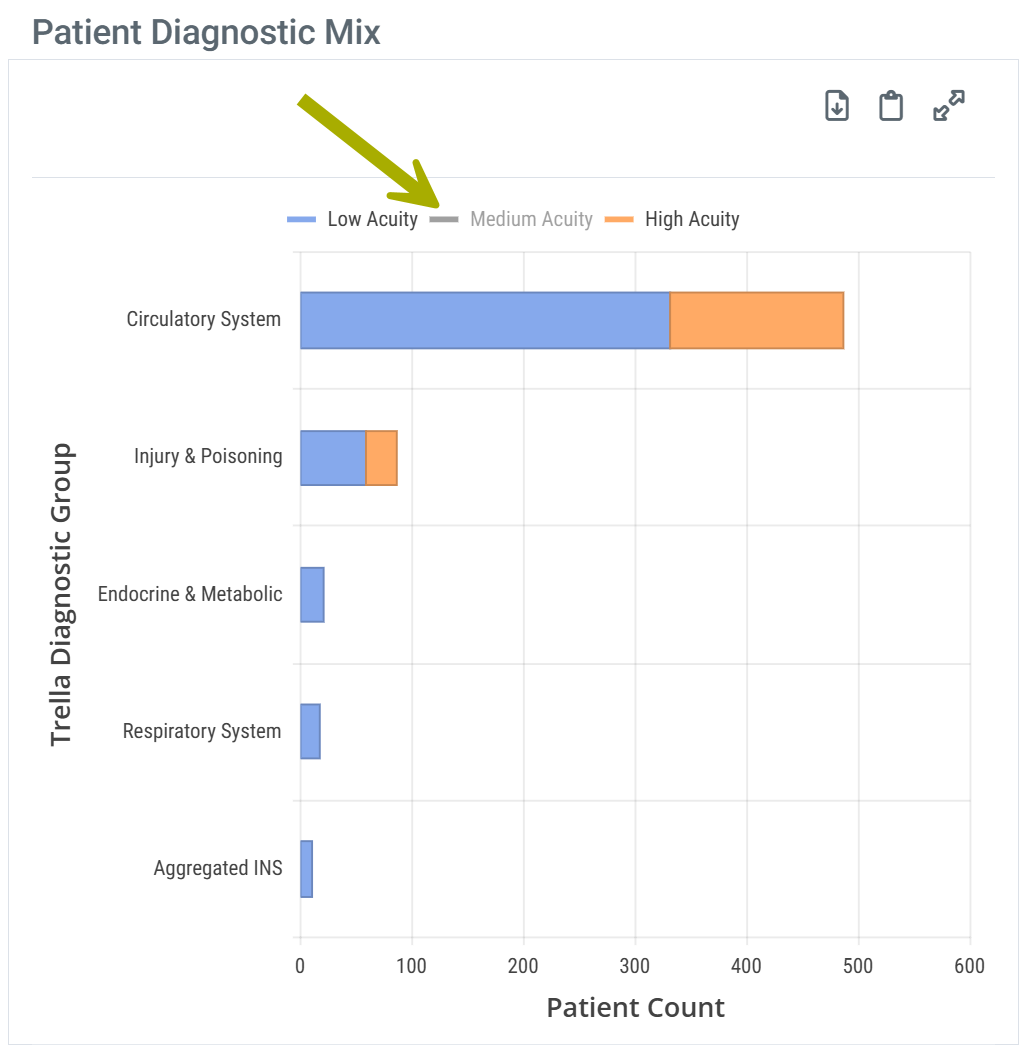
With chart view on the Patient Diagnostic Mix chart has a legend that identifies the elements in the chart. Each different identifier in the legend can be toggled on and off to display or hide the matching elements in the chart. Hovering over an identifier highlights the related elements in the chart.
| |
| Chart Legend | Legend Customize |
 |
 |
Metric Details
Trella Diagnostic Group
Each diagnostic category represents a collection of similar diagnoses that align with the diagnostic category name.
![]() For more information on the Diagnostic categories used in the table, see Trella Health Diagnostic Categories.
For more information on the Diagnostic categories used in the table, see Trella Health Diagnostic Categories.
Annual Patient Count
The numbers in this column represent the counts of patients treated by the selected physician within the previous two years with a principle diagnosis that falls within the diagnostic category in the listed row.
Low, Medium, or High Acuity
These three columns break out the counts for three levels of acuity. The number in each column is the count of low, medium, and high acuity patients with a diagnosis included in the diagnostic category listed.
![]() For more information on the Diagnostic categories used in the table, see Trella Health Diagnostic Categories. For more information on how Trella Health assigns levels of acuity, see Trella Health Patient Acuity.
For more information on the Diagnostic categories used in the table, see Trella Health Diagnostic Categories. For more information on how Trella Health assigns levels of acuity, see Trella Health Patient Acuity.
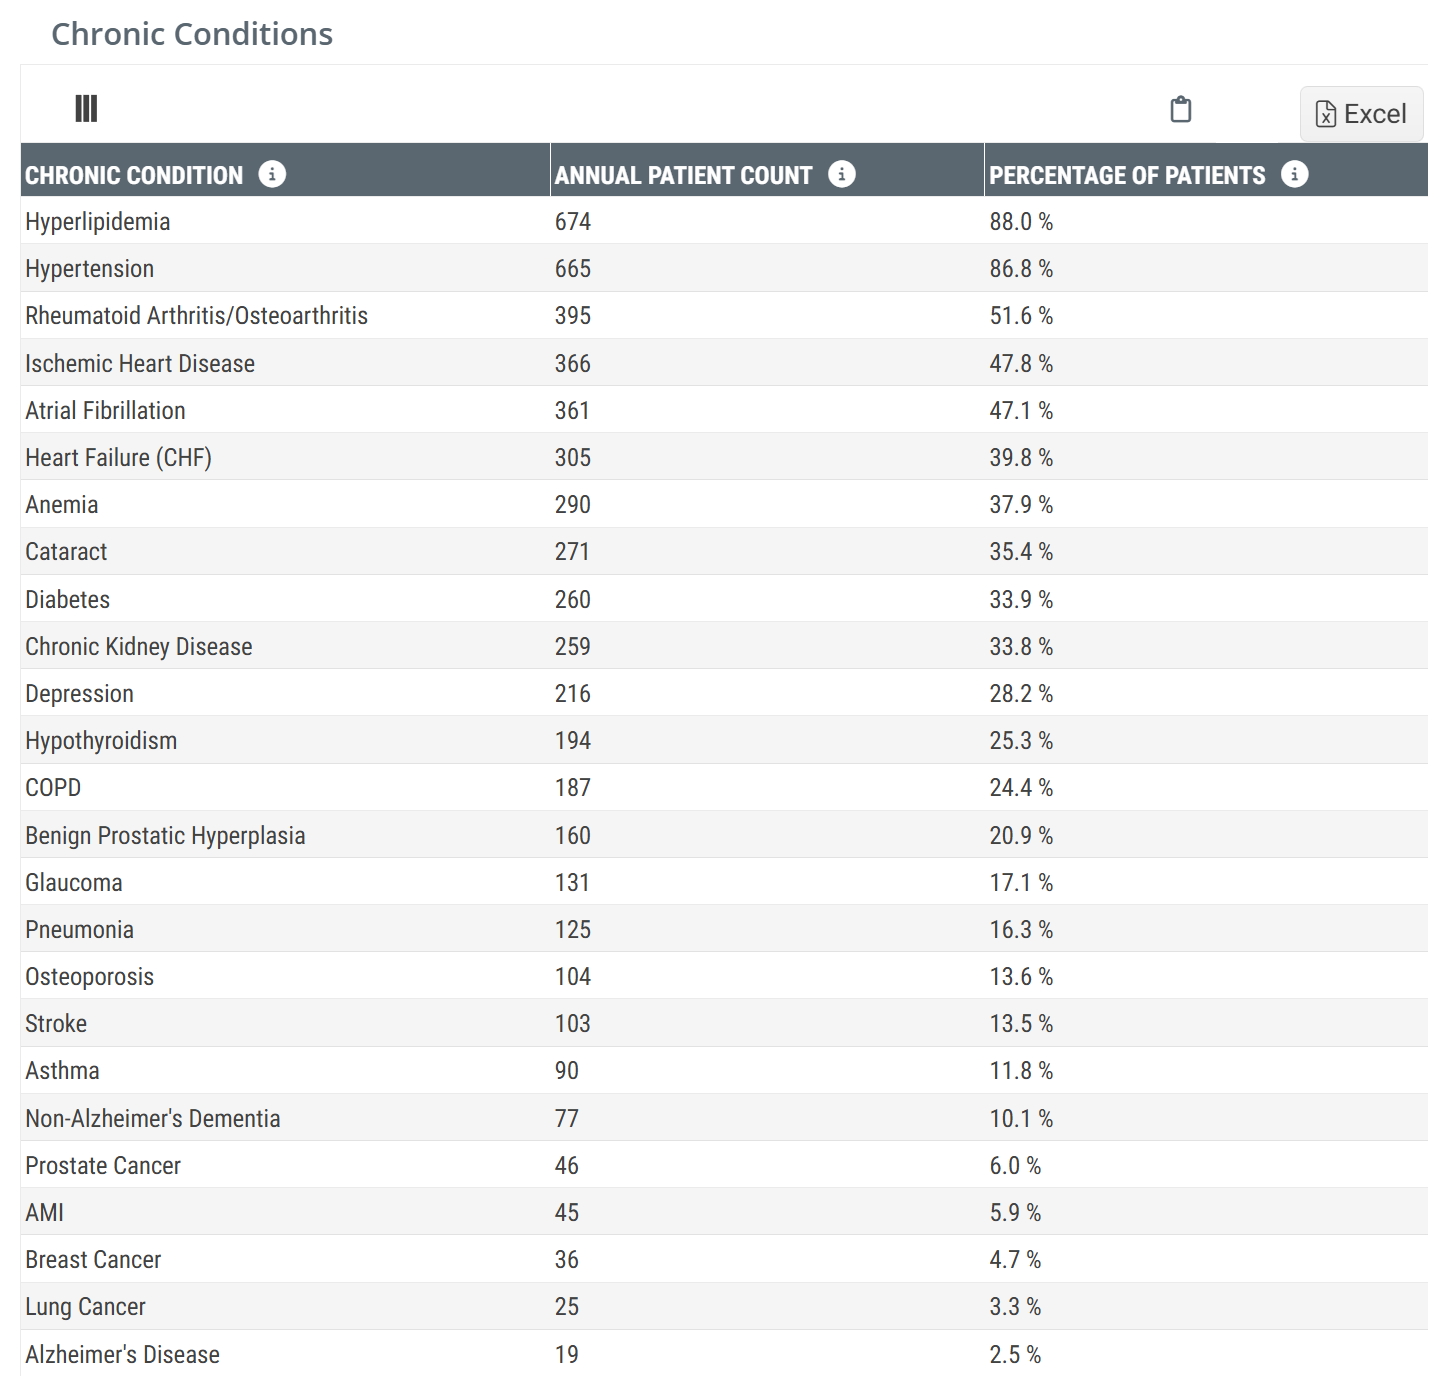
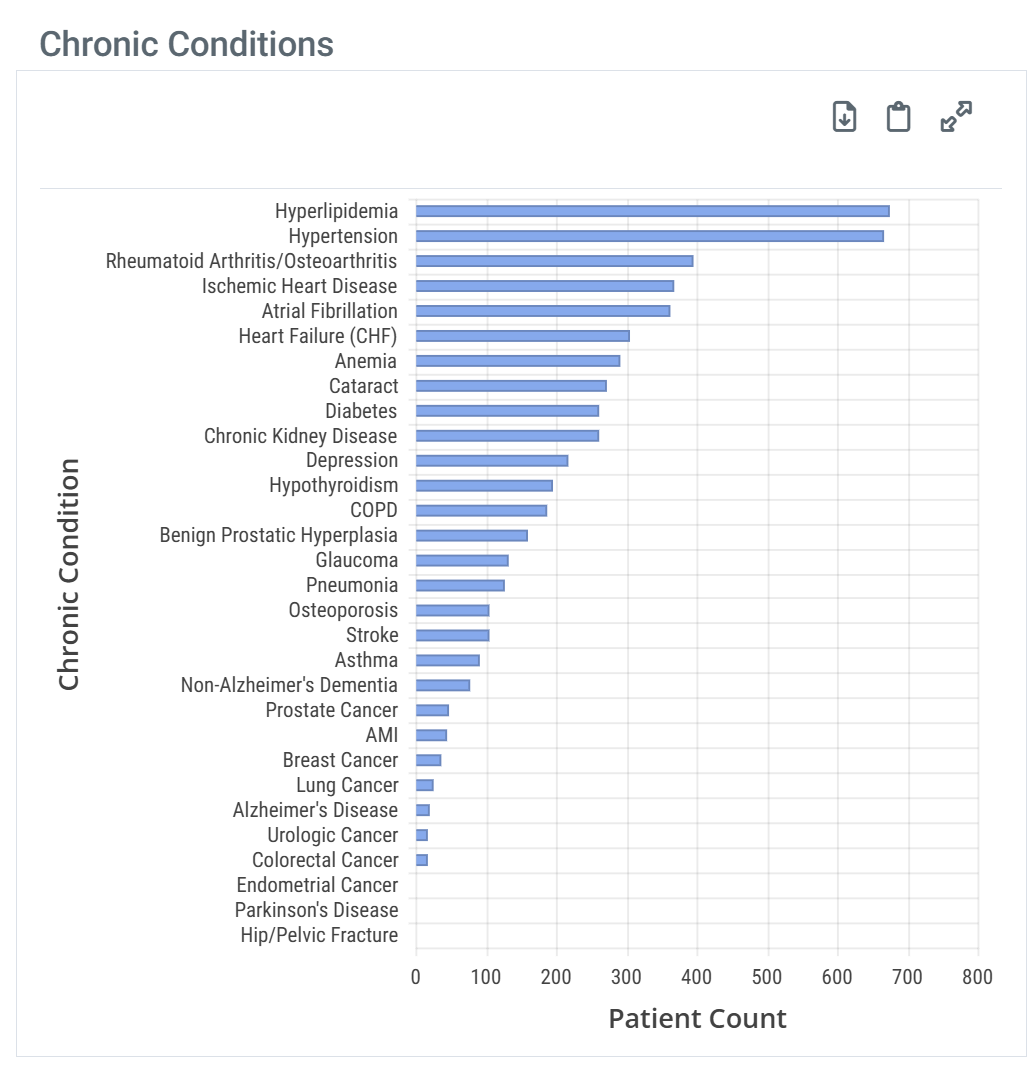
Chronic Conditions
This table contains the counts and percentages of the selected physician's patients diagnosed with the listed chronic conditions.
Chart View and Table View
|
Off
|
 |
|
On
|
 |
| When you hover over a bar in the Chronic Conditions chart, the count for the chosen bar is shown. | 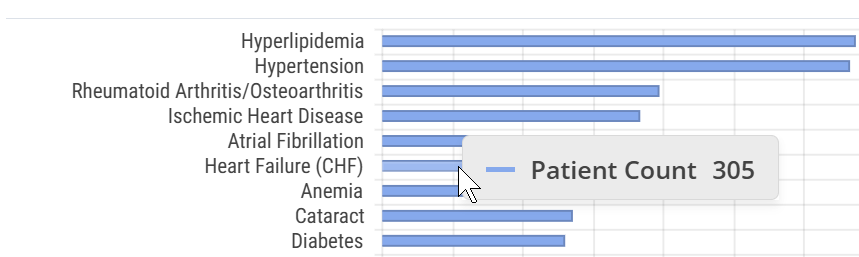 |
 Metric Details
Metric Name |
Description |
| Chronic Condition |
The name of condition developed from CCW Chronic Condition algorithms that search the CMS administrative claims data for specific diagnosis codes, MS-DRG codes, or procedure codes |
| Annual Patient Count | The count of distinct patients treated by the selected physician during the one-year reporting period who met the criteria for the listed chronic condition based on the CCW Chronic Condition algorithm. |
| Percentage of Patients | The percentage of patients treated by the selected physician who met the criteria for the listed chronic condition based on the CCW chronic condition algorithm. |
![]()
- The listed percentages will not add up to 100%, since patients treated by the physician could be diagnosed with chronic conditions listed in more than one row.
- The algorithms used to create this table can be found at the Chronic Conditions Data Warehouse website
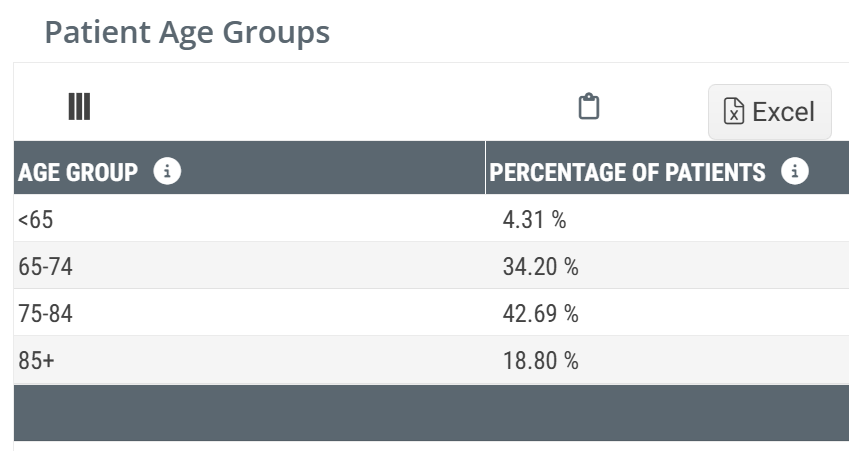
Patient Age Metrics
The last two tables and one chart under the Patient Population tab provide age demographics.
Chart View and Table View
|
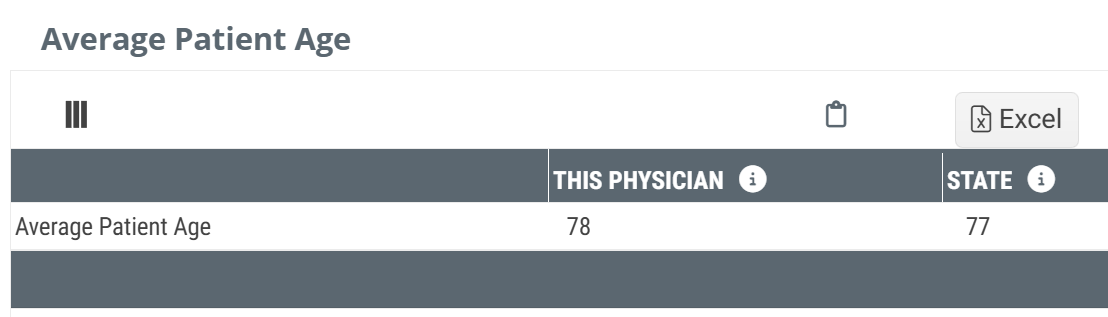
There are two tables related to patient age. Patient Age Groups (top - which aligns with the Patient Age chart) and Average Patient Age (bottom) |
 |
 | |
|
On
|
 |
| When you hover over any bar in the Patient Age chart, the metrics for the different patient counts represented in the chart are displayed. | 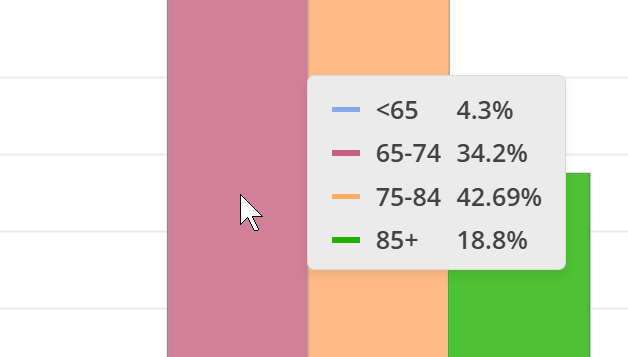 |
|
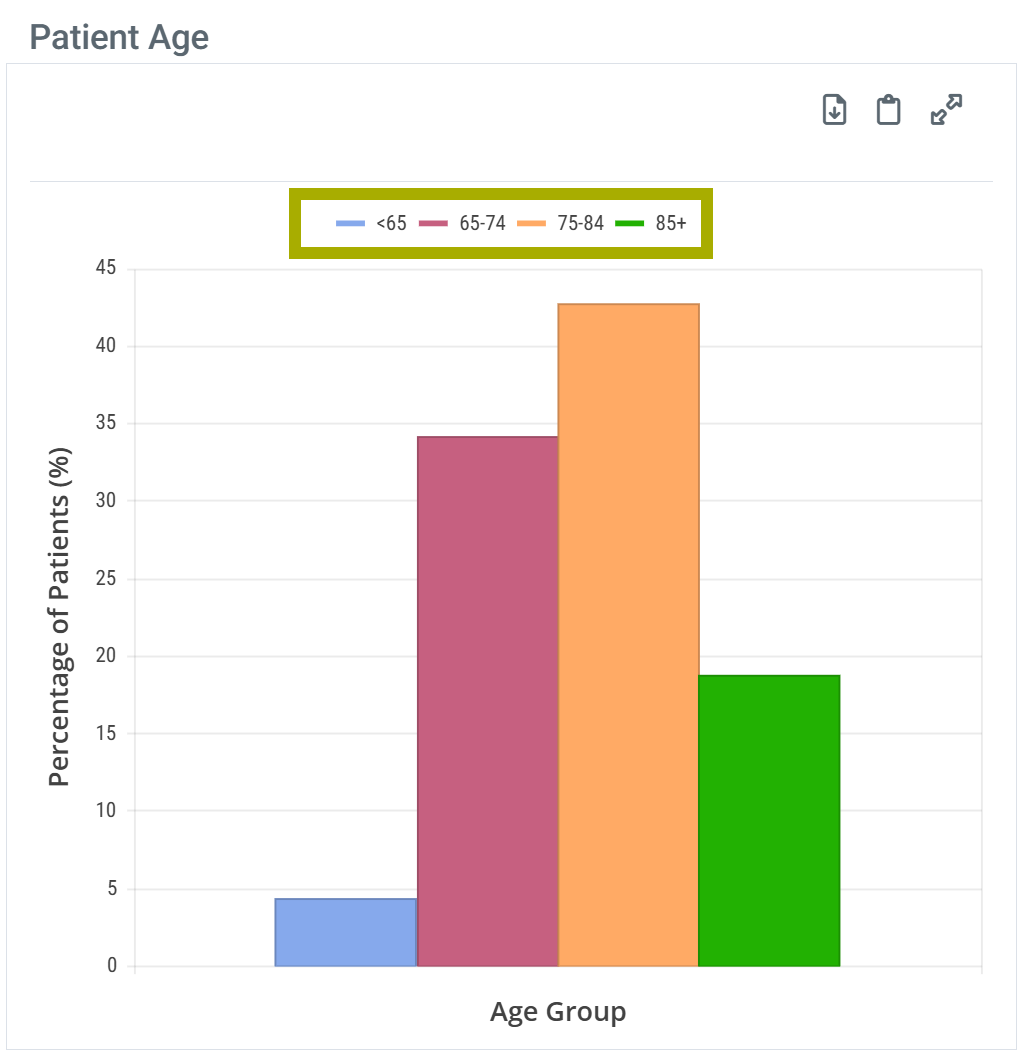
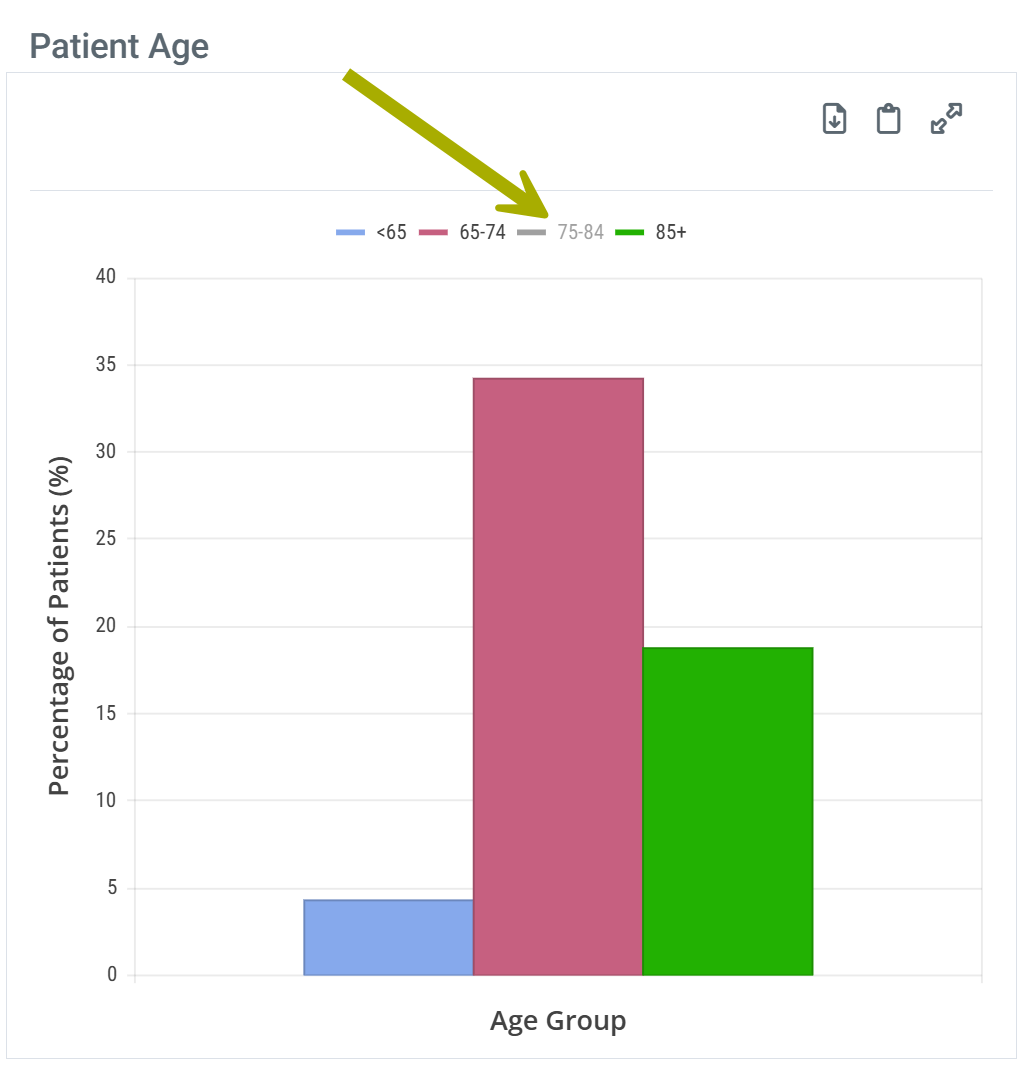
With chart view on the Patient Age chart has a legend that identifies the elements in the chart. Each different identifier in the legend can be toggled on and off to display or hide the matching elements in the chart. Hovering over an identifier highlights the related elements in the chart.
| |
| Chart Legend | Legend Customize |
 |
 |
Metric Details
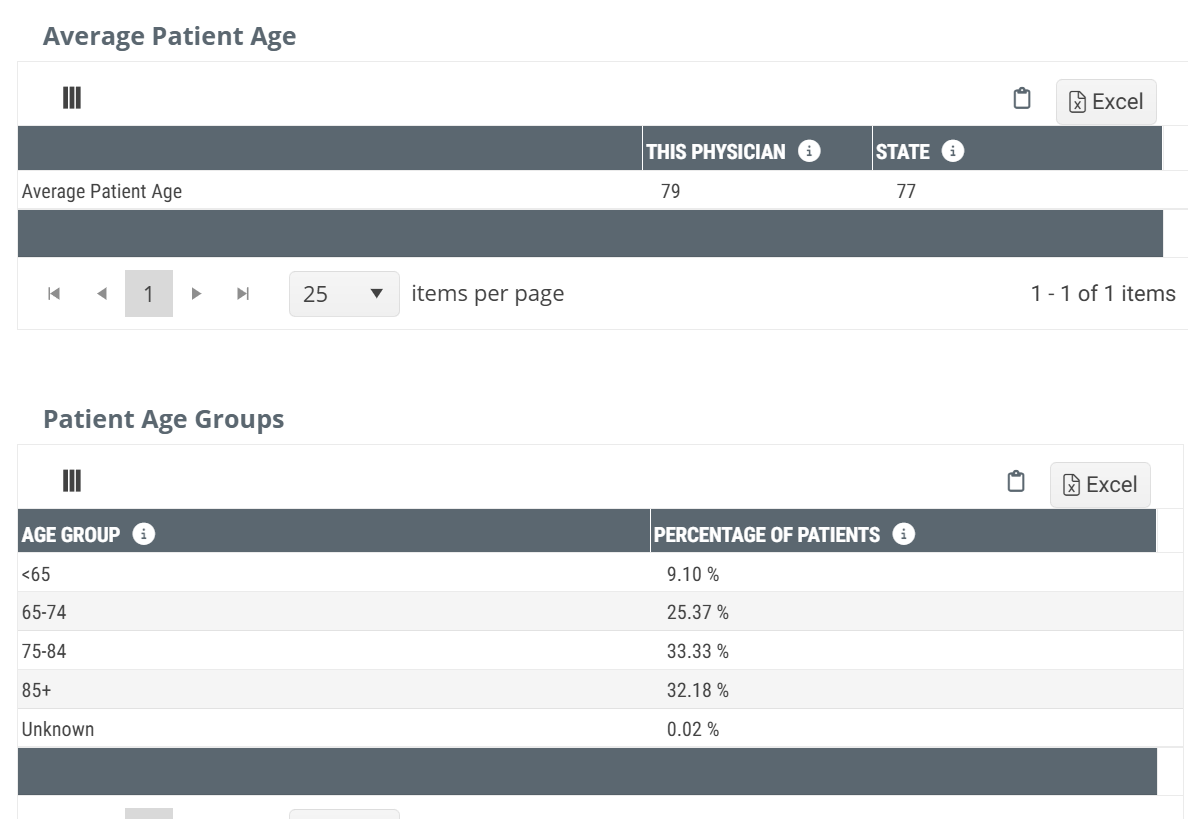
Average Patient Age
The average age of patients treated by the selected physician with the state average age of patients for physicians with the same specialty for comparison.
Patient Age Groups
This table present the percentages of the selected physician's patients broken out by age.