Overview
There are two tables on the Physician Analyze page.
- The FFS Home Health Destinations table contains a list of all home health agencies that admitted Medicare FFS patients treated by the selected physician. There is a dropdown selection that allows you to narrow the table to include only metrics for one of the three breakout claim types, Followed, Last Claimed, and 3 Months Prior.
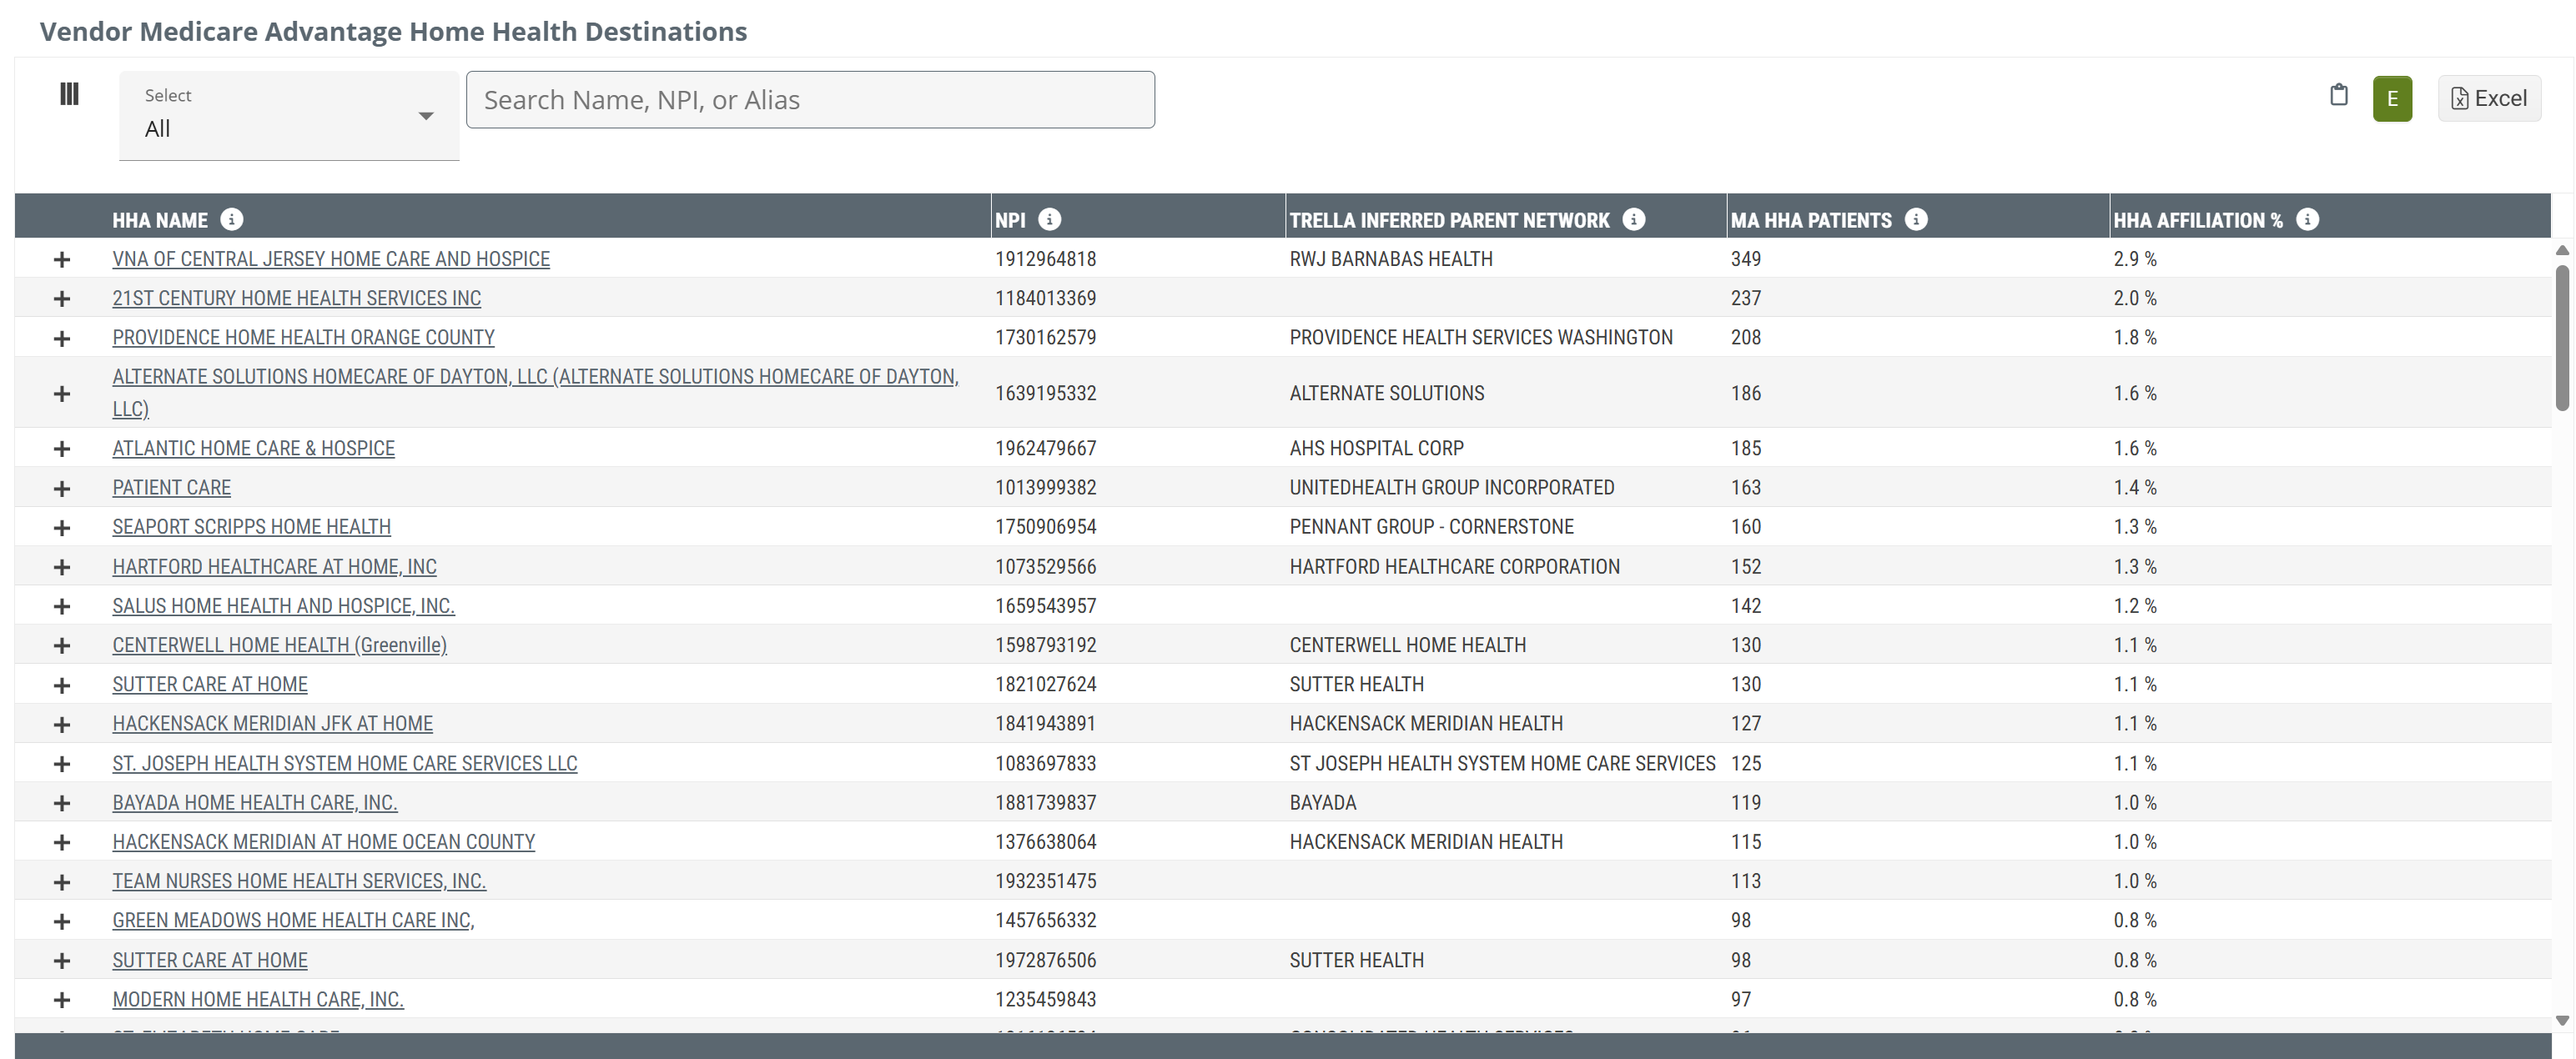
- The Vendor Medicare Advantage Home Health Destinations table shows home health agencies that admitted Medicare Advantage patients treated by the selected physician.
![]() These tables are found under the Destinations tab on the Analyze page.
These tables are found under the Destinations tab on the Analyze page.

![]() The primary value of the tables is that it shows part of the patient flow through the healthcare continuum, in this case from the physician to the listed Home Health agencies, which identifies populations of patients and the informal Home Health referral relationships between the physician and treated patients.
The primary value of the tables is that it shows part of the patient flow through the healthcare continuum, in this case from the physician to the listed Home Health agencies, which identifies populations of patients and the informal Home Health referral relationships between the physician and treated patients.
Understanding the Metrics
Below you will find the definitions for the metrics in the two tables under the destinations tab.
FFS Home Health Destinations
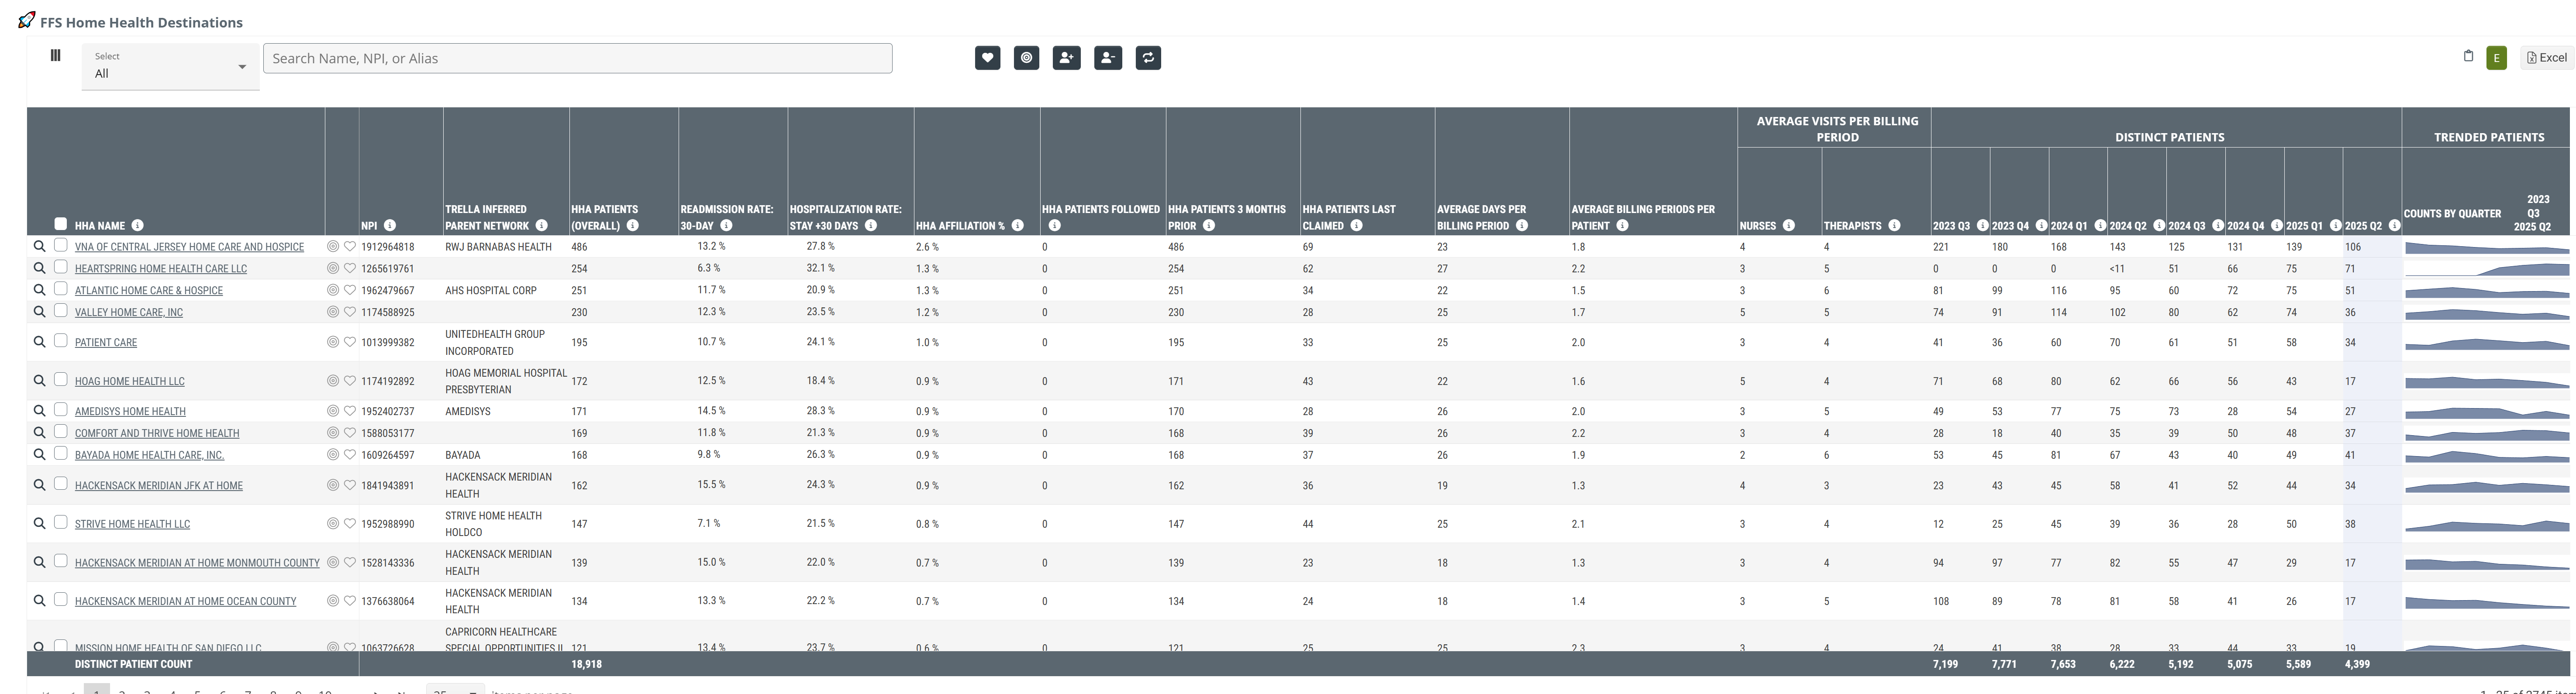
![]() So, yeah, this table is huge. Click on the image to expand it.
So, yeah, this table is huge. Click on the image to expand it.
Metric |
Description |
|
| Home Health Agency Name | The official entity name of the Home Health Agency as listed in CMS Provider Data (NPI) file | |
|
Favorites/Targets
|
Click on these icons to make the listed organization a Favorite (heart icon) or a Target (target icon). | |
| Trella Inferred Parent Network | If the listed home health agency is aligned with a Trella Inferred Patent Network, the network ID is identified in this column. | |
|
HHA Patients (Overall |
This is the count of the selected physician’s distinct patients who received home health services during the reporting period. It is limited to patients who were counted under the three claim types, Patients Followed, Patients 3 Months Prior, and Last Claimed Patients. As such, it is a union of these three claim types, not a total, because a patient could be counted under more than one claim type. | |
| Readmission Rate: 30-Day | This metric is the percentage of the selected physician's patients admitted to the home health agency in the row directly from a hospital stay and who were subsequently readmitted to an acute care hospital within 30 days of the initial discharge. | |
| Hospitalization Rate: Stay +30 Days | This metric is the home health agency’s two year overall rate of hospitalization (where patients were admitted to a short-term acute stay during an HH services episode (includes transfers) OR within 30 days of Home Health discharge) | |
| HHA Affiliation % | The percent of home health patients treated by the selected physician who were admitted to the listed agency during the reporting period. | |
| HHA Patients Followed | The count of distinct patients who received services from the named agency during the most recent four quarters with the physician listed as the certifying physician on the home health final claim. | |
| HHA Patients 3 Months Prior | This metric is the count of distinct patients admitted to the listed agency during the reporting period who were treated by the physician during the three month reference period prior to the patient's home health admission. | |
| HHA patients last claimed | This is the count of distinct patients who were admitted to the listed agency for whom this physician filed the last professional claim prior to the patient's home health admission. | |
| Average days per billing episode | This is the average number of days per home health billing episode for patients treated by the listed agency during the reporting period who were treated by the selected physician during the three month reference period prior to the patient's home health admission. | |
| Average billing episodes per patient | The average number of consecutive home health billing episodes per patient for those patients discharged by the listed agency during the reporting period who were also treated by the physician within the three month reference period prior to their home health admission. | |
| Average visits per billing episode | Nurses | This is the average number of nursing visits (RN or LPN) per home health billing episode conducted by the listed agency for patients who were treated by the selected physician within 3 months of their home health admission. |
| Therapists | This is the average number of therapy (PT, OT, SLP) visits per home health billing episode conducted by the listed agency for patients who were treated by the selected physician within 3 months of their home health admission. | |
| Distinct Patients |
This number is the count of the selected physician's distinct patients admitted to the listed agency during the quarter specified in the column header, including patients followed, patients 3 months prior, and patients last claimed.
|
|
| Trended Patients | The trend line uses the counts from the Patient Admits columns to the left. The visual created gives a perspective on the home health agencies historical level of care for the selected physician's patients. If you hover over the line, the count for each quarter will appear. This is the count of distinct patients treated by the physician who were admitted to the home health agency during the identified quarter. | |
Vendor Medicare Advantage Home Health Destinations
Metric Name |
Description |
| HHA Name | The official entity name of the listed home health agency as listed in CMS Provider Data (NPI) file |
| NPI | The NPI for the listed home health agency |
| Trella Inferred Parent Network | If the listed home health agency is aligned with a Trella Inferred Patent Network, the network ID is identified in this column. |
| MA HHA Patients | The count of distinct Medicare Advantage patients treated by the physician (Followed, 3 Months Prior, and Last Claimed patients) who received home health services from the listed home health agency during the one-year reporting period. |
| HHA Affiliation % | The percentage of distinct Medicare Advantage patients treated by the physician (Followed, 3 Months Prior, and Last Claimed patients) who received home health services from the listed home health agency during the one-year reporting period. |